The problem of determining whether synthetically-generated landscapes are sufficiently representative of real landscapes is remarkably analogous to that of determining whether computer behavior sufficiently resembles human cognition; in both cases, there are no universally-accepted criteria for testing. Alan M. Turing (1912-1954) recognized this lack of objective criteria, and proposed a subjective but exclusive test for machine intelligence, which we borrowed and adapted for testing the Fractal Landscape Realizer. The Turing Test represents only part of our evaluation of the synthetic landscapes; we are also comparing several landscape metrics and geostatistical parameters from both the synthetic and real maps.
The first 15 maps that were presented during each Turing Test were randomly selected from 17 real maps that were clipped from a single source map which represented areas similar with regard to annual temperature, precipitation, elevation, plant-availiable water content of soil, and soil organic matter. The last 5 choices in each test were always repeats of real maps that the expert had seen previously. We displayed repeats in order to collect data on the performance of different realizations from the synthetic generator within a single observer. To disguise these repeated maps, we flipped them about the vertical, horizontal, or diagonal axis.
Many experts were surprised by the fact that some categories (colors) were identical in both maps of some pairs. The constraint feature of the Fractal Realizer allows the user to supply a spatial probability surface for any category. If one specifies absolute certainty in all places occupied by a category in the real map, then that category will be identical in the synthetic version.
The constraint feature was used in another way as well. Rather than as an absolute constraint, the elevation underlying the map was supplied as a spatial probability constraint. Normally, this results in preferential placement of that category along the ridgelines. But, if inverted, the elevation constraint encourages features that follow valley bottoms. In either case, dendritic patterns result which are non-fractal and are otherwise difficult to simulate. Elevationally- constrained categories are not identical from realization to realization.
Interestingly, elevation-constrained categories often showed a ``salt-and-pepper'' speckling due to the inherent roughness of the underlying digital terrain model. Several experts recognized this speckle as a difference between the maps. However, some took it as a result of classification of a remote image, and picked such maps as real. Others suspected that it was a result of an imperfect simulation program, and picked such maps as synthetic. Performing a smoothing pass on the elevation model would have probably eliminated this effect entirely, making the choice among map pairs even more difficult.
Most experts who took the test provided comments about their techniques for discerning the real maps, and these comments were most interesting, helpful and amusing. Click here to see all expert's techniques and comments given during the Turing Test.
Some experts commented that any pattern could be real; that one could probably find a spot on the earth which fit any pattern whatsoever. While this may be true, the great majority of experts realized that some patterns are more frequently observed in nature than others, and that this could form the basis for the test.
Several experts pointed out that the scale of analysis, categories of information, and geographic study area are always provided to a viewer of a cartographic product, since, without this, the map cannot be used. In the Turing Test, the interrogator can communicate with the human subject and the computer only by teletype in order to insure that the interrogator's choice is based solely on the responses and not ancillary clues. To be analogous, we withheld information on the scale and nature of the source map. Furthermore, in the Turing test, the human subject is actively trying to confuse the interrogator into believing that the computer is intelligent. Similarly, we constrained certain parts of the maps in order to make them appear more realistic.
In retrospect, I wish that we had divulged information about the scale and nature of the source maps, because I personally believe that it would not have made any difference in the expert's scores. The Fractal Realizer would have passed an even more stringent test, while at the same time deflecting this criticism.
If we assume that the Turing Test of the Fractal Realizer represents a binomial event, i.e., that the selection of maps is either correct or incorrect, and that each map choice represents an independent trial, then the expected random outcome is given by the binomial distribution where the likelihood of choosing correctly, p, and the likelihood of choosing incorrectly, q, each equal 0.50. Under these circumstances, a one-tailed test requires that a person score at least 17 correct out of 20 to overthrow the null hypothesis that the selection is random. Only one expert of more than 100 taking the test had such a score.
Some experts may have discerned a difference between the maps, but may have mistaken the synthetic maps for the real ones, thus consistently choosing incorrectly. Like marking a True/False test backwards, these people flunked the test, but should have gotten an ``A.'' A two-tailed binomial distribution requires less than 3 or more than 17 correct to reject the equally-likely random hypothesis. No one taking the test met this criterion.

Of course, these simple binomial cutoffs only consider individual
test results, not the entire combined population of experts taking the
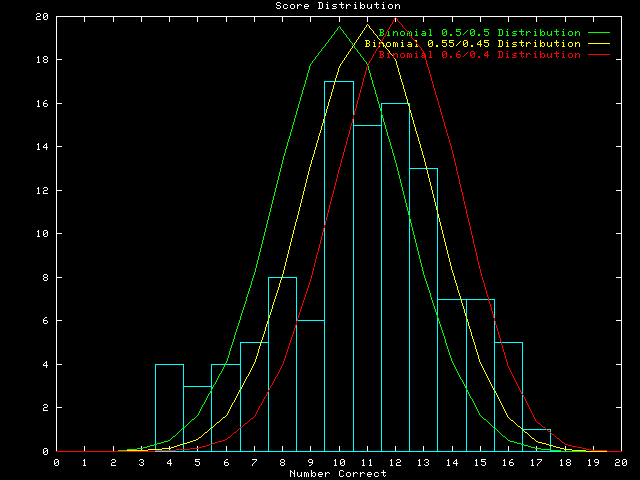
test. The population of Turing test scores is shown as an histogram above. A ![]() 2 goodness-of-fit test of the
population of scores against a binomial where p = q =
0.50, shown as the green leftmost curve in the histogram, results in a
2 goodness-of-fit test of the
population of scores against a binomial where p = q =
0.50, shown as the green leftmost curve in the histogram, results in a ![]() 2 statistic of about 55. The
critical
2 statistic of about 55. The
critical ![]() 2 value for
2 value for ![]() = 0.05 with 20
degrees of freedom is 31, so we reject the null hypothesis that the
population of scores is from an equally-likely random binomial.
Either the likelihood of choosing correctly was not equal to the
likelihood of choosing incorrectly, or the choices for each map were
not independent trials.
= 0.05 with 20
degrees of freedom is 31, so we reject the null hypothesis that the
population of scores is from an equally-likely random binomial.
Either the likelihood of choosing correctly was not equal to the
likelihood of choosing incorrectly, or the choices for each map were
not independent trials.
The random binomial distribution (yellow curve) is symmetrical about
the 0.5 mean, but the histogram of scores is not. The scores are slightly
convex on the high side and slightly concave on the low side of the mean,
except for a small bump of scores around 5. The grand mean is somewhere
between 11 and 12 correct, representing an estimated p of about
0.59. If we compare the scores histogram with a slightly-assymetrical
binomial in which p = 0.6 and q = 0.4, shown as the yellow
middle curve, the fit is generally better, except for the bump at the
low end of the distribution. The ![]() 2 goodness-of-fit here is about
95, still too large to accept the null hypothesis that the distribution
is binomial with p = 0.6.
2 goodness-of-fit here is about
95, still too large to accept the null hypothesis that the distribution
is binomial with p = 0.6.
However, the bump of scores around 5 is responsible for most of this
disagreement. Without considering the lowest lumped category (0
through 7) in the ![]() 2, the fit to the binomial with
p = 0.6 is well within the
2, the fit to the binomial with
p = 0.6 is well within the ![]() 2 critical value at
2 critical value at ![]() = 0.05.
= 0.05.
We conclude that the Turing Test suggests that experts can still, more often than not, discern real maps from those created by the Fractal Realizer. Their performance, however, is measurably but not appreciably better than random chance alone.
It is possible that the fits to the binomial distributions resulted from the fact that the experts learned during the test. As they were presented with more pairs of maps, the experts probably devised rules for selecting the real maps. Even though they were given no feedback during the test, simply experiencing more pairs of maps may have permitted enough learning to make the pairs no longer represent independent trials, violating one of the assumptions of the binomial model.
We ascribe the bump around 5 in the distribution to have resulted from a small group of experts who discerned rules for distinguishing between the real and synthetic maps, but incorrectly guessed which way that those rules operated.
We can also analyze the Turing Test results in terms of the actual individual maps that were presented. The above histogram plots the percentage of tests in which each real map was missed. Thus, tall histogram bars indicate maps that were missed almost every time they were shown. These maps were easy to simulate with the Fractal Realizer. Short histogram bars represent maps that the experts were easily able to identify as real. Something about these maps was very difficult to simulate.
Click on the individual bars in the above histogram to see the real map, along with a synthetic version of it. You can click reload from any real map page to get a different synthetic map from the Fractal Realizer.
Examination of real maps with high and low bars makes it possible to identify the characteristics that make maps easy and hard to simulate. Easy maps to simulate, like map 3 and map 10, were generally isotropic patterns (without directionality). These patterns were amenable to simulation with fractals. Other maps, like map 16, showed a northeast-southwest directionality from the Appalachian mountain range which was difficult to simulate. Difficult maps like map 11 had significant dendritic features which were hard to ``fake'' realistically.
However, another interpretation is possible. Any difference in histogram bar height from the 50% line indicates some difference between the real map and the synthetic ones. Perhaps any differences between real and synthetic maps should be viewed as a bad side effect of the Fractal Realizer. This is the equivalent of the two-tailed test within an individual map. It is just as bad if the Realizer produced more realistic maps than the actual ones than if the synthetic maps were easily distinguishable from the real ones. This is an interesting quandry in which the Realizer can perform too well as easily as performing too poorly.
We are not inclined to adopt this two-tailed viewpoint. The easily generalizable isotropic characteristics shared by maps having tall histogram bars strongly suggests that it was these characteristics that made these maps difficult for the experts to select from the synthetic versions.


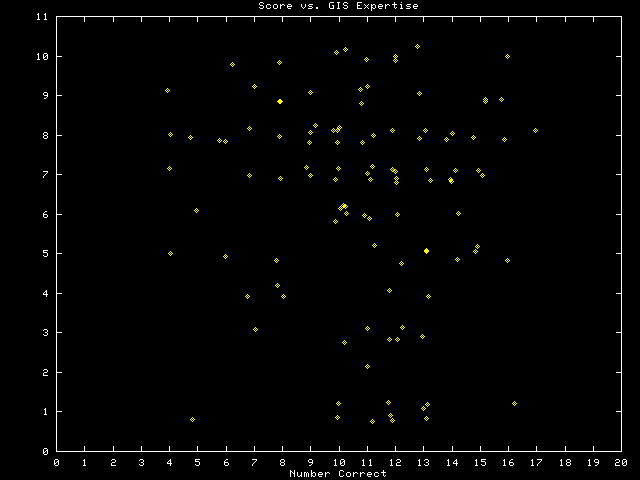
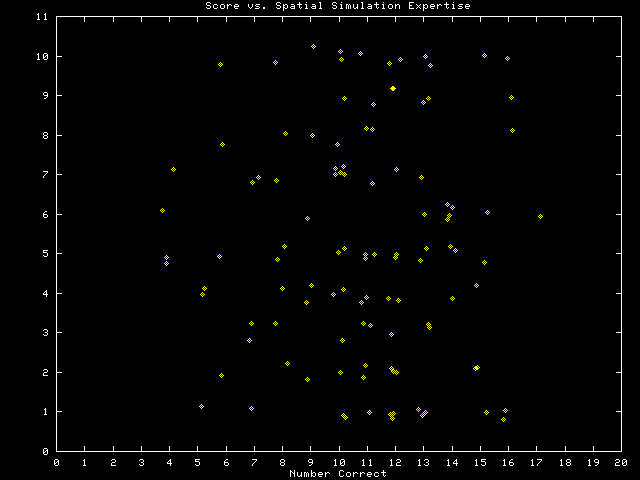
Self-rankings of GIS expertise and spatial simulation expertise, shown above, showed no relationship with final score on the test. Similarly, there was no relationship between the evaluation rankings given to the Fractal Realizer by the experts and their test scores.
We are also comparing the synthetic maps and the real maps using a number of landscape metrics and indices, and with geostatistics. Results of these comparisons will be included in the forthcoming manuscript.
Now that the invited experts have completed the Turing Test and the statistics have been calculated, we intend to open the test to any other interested persons. Although their scores will no longer count in the actual analysis, we have created a set of Web pages which will permit the continual monitoring of the cumulative results of the Turing Test of the Fractal Realizer. These three pages dynamically generate each of the graphs statically shown on this page, so that the current state of the continuing Turing Test can be monitored by anyone at any time.
It will be interesting to see if the mean score decreases, and if increased sample size fills out the distribution of scores and improves fit to one of the binomial curves.
If you have any data interpretation insights or general comments, please contact