William W. Hargrove


- William W. Hargrove
- Eastern Forest Environmental Threat Assessment Center
- USDA Forest Service
- Southern Research Station
- 200 WT Weaver Boulevard
- Asheville, NC 28804-3454
- (828) 257-4846
- (865) 235-4753 (cell)
- hnw@geobabble.org
Here is a more formal and a less formal and a really less formal picture of me. Other portraits here.
Here I am taking a position fix
using the Global Positioning System (GPS) in Yellowstone National Park
in 1993, where I helped study the effects of
large-scale fires on the landscape (first web page I ever put up!). Notice that I am surrounded
not only by burned trunks, but also by vigorously regrowing
seedlings. Here I am examining hail damage detected by the ForWarn system in 2012, high up on the Asheville Watershed, from which the city of Asheville gets its drinking water.
The “William W Hargrove” page on Google Scholar reports an h-index of 36 for my publications, meaning that I have 36 publications each of which have been cited by others at least 36 times. My g-index, which considers all highly cited papers, is 84, and my i10 index is 74, indicating that I have 74 publications with at least 10 citations by others. My three most-cited publications have over 500 citations each, followed by two with over 400 citations each. My nine most-cited publications have more than 250 citations each.
Publications
Education and Professional Experience
Some of my most significant mentors include Dac Crossley (and here,) Dick Wiegert and Bob Gardner.
Honors and Awards
Major Research Projects
Presentations (since 2000)
Here is a professional profile and biosketch.
Here is my biosketch in MS Word, and a 2-page CV in MS Word and pdf format. I am married to Dr. Rebecca A. Efroymson (and here), and we have two children, one son, Sam and one daughter, Amira.
In October 2012, our 16-person ForWarn Team, which contains employees of four different U.S. Government Agencies (USDA FS, NASA Stennis, USGS EROS, and DOE ORNL), was selected by Dr. Rob Doudrick to receive the 2012 Southern Research Station Director's Award for Excellence in Science Delivery. On behalf of the entire ForWarn Team, it was my great honor to travel to the North Carolina Museum of Natural Sciences in Raleigh to recieve this award. Dr. Doudrick presented us with a beautiful trophy and clock. In addition to the trophy, each member of the ForWarn Team will receive an engraved wooden placque announcing the award. Here is the Program used during the Awards Presentation Ceremony.
In April 2006, I was astonished to receive the S.I. Auerbach Award for
Excellence in Environmental Science for 2005. Before presenting
the Award, my Division's Director
gave an introductory speech, revealing in stages who had won
the Award. In my acceptance
presentation, I tried to highlight a few consistent directions
in my random-walk ecological career. The Environmental Sciences
Division gave me a fancy
plaque and a framed
certificate that tells a lot of very nice lies about me. They also put up a poster in the lobby showing the august group of past awardees.
Early older ORNL projects with which I was involved that have Web pages include:
I created the Fractal
Landscape Realizer with Paul Schwartz and Forrest Hoffman, which generates synthetic multiple-category
landscape maps to users' specifications. You can use the Fractal
Landscape Realizer to simulate an actual
landscape on-the-fly. Click reload to generate another custom
synthetic landscape.
To test how well the synthetic landscapes resembled actual maps, we
performed a variation of the Turing Test
for machine intelligence. In the first phase of our Turing Test of the
Fractal Landscape Realizer, we invited more than a hundred experts,
when presented with a series of 20 pairs of maps, to distinguish the
real map from a synthetic realization. The synthetic landscape
realization from each pair was generated by the Fractal Realizer ``on
the fly''; therefore, no two experts experienced exactly the same
Test. A Preliminary
Turing Test Analysis for the first phase of the Test indicated a
mean of between 10 and 11 correct in 20 pairs. There was no
obvious relationship between score vs.
self-rated expertise.
Although the statistical analysis for publication was completed, we
released the Continuing
Turing Test of the Fractal Realizer to several ecology-,
statistics-, and GIS-related Usenet news groups and listservers. As of
this writing, nearly 500 people have taken the Turing Test. Anyone can
at any time examine the real-time
distribution of scores and the real-time percent
incorrect choices by map to monitor how the results from the
Continuing Turing Test are developing. In addition to the Turing Test
approach, we have statistically compared populations
of Fractal Realizations to actual maps using Landscape Metrics.
I also participated in an international internet experiment on
Spatial Interpolation Comparison. By employing different spatial
interpolators on the same dataset, we compared their relative
effectiveness. Participants received 30% of a dataset and had to
interpolate the 70% which is missing. The data were daily rainfall measured in
Switzerland when the radioactive cloud released from the Chernobyl
Nuclear Power plant passed over Europe.
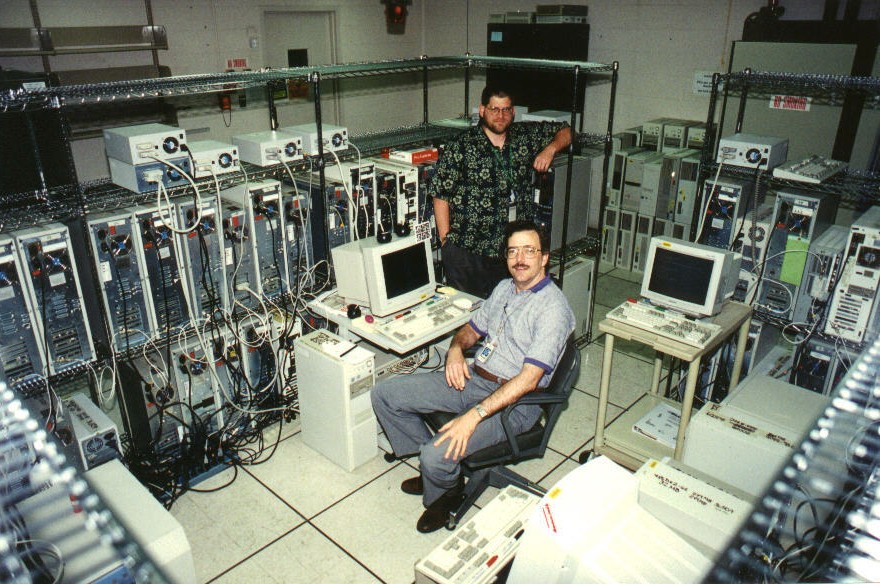
Forrest Hoffman and
I built ORNL's first Beowulf-style parallel supercomputer
using personal computers as building blocks. This machine is one of a
dozen or so such machines presently operating. Because we have no
actual funding for this research, we started by using old surplus486 PCs which
had been discarded from all over ORNL. We combine and trade parts
until we obtain a minimum configuration, and then we add the PC as an
additional processing node in the compound parallel machine. In
keeping with the budgetary philosophy of this unfunded project, we
dubbed the machine the "Stone SouperComputer", after the story of
stone soup (also here). We used the Stone SouperComputer to
perform several landscape-scale ecological analyses which would have
been very difficult to accomplish on a single serial workstation.
The press has been very interested in our Stone SouperComputer. We were Slashdotted twice for the Stone SouperComputer, the first time in August 1998, and the second time in July 2001. The
RidgeLines ORNL newspaper did a front-page article on us,
entitled "A
poor-man's supercomputer", and so did the
University of Tennessee Daily Beacon.
Our Beowulf effort was described in Science InScight, and was even translated into Italian, spanish and German. Our machine was
also covered in the DOE Pulse.
Stone Soup was covered in the Chicago Tribune as Stone cold cheap supercomputing, and we were discussed at length in
SlashDot as The No Cost Super Computer.
The American Association for the Advancement of Science interviewed Forrest regarding the Stone
SouperComputer. The AAAS Science Update radio program was broadcast
Friday, Feb. 18, on the Mutual Broadcasting System, but you can hear the
interview now as a RealAudio file here.
We were invited in 2001 to prepare a
manuscript describing the machine for Scientific American magazine. Thomas Sterling, the
inventor of Beowulf-style compound computers, was our coauthor.
The Knoxville News-Sentinel included us in a special section on an ORNL "Renaissance" in 2002.
I'm proud that our Stone Soupercomputer work is listed twice in Wikipedia, once under Stone Soupercomputer, and once under computer cluster.
For all of the Stone
Soup items, look here
At its largest, the Stone SouperComputer contained 128 individual PC nodes, with roughly half being Pentium-based machines. In 1999, we obtained shelves for almost all of the nodes
, which we arranged in a
fortress-like configuration. Forrest and I received an ORNL Teamwork Award for building Stone
Soup. Click here to learn more about the Stone
SouperComputer.
We also designed and constructed a new computing cluster that was used to produce most of the map products for the U.S. Forest Service Landfire project.
Here are some of the things that we have written about the Stone Souper, or
about projects that we have completed using Stone Soup:
- Mahinthakumar, G., F. M. Hoffman, W. W. Hargrove,
and N. T. Karonis. November 13-15, 1999. Multivariate
Geographic Clustering in a Metacomputing Environment
Using Globus. Proceedings of the ACM/IEEE SC99 Conference, Portland, OR.
- Hoffman, F. M. and W. W. Hargrove. Fall 1999. "Parallel
Computing With Linux." Crossroads,
Volume 6, Number 1.
- Hargrove, W. W. and F. M. Hoffman. July/August 1999. "Using Multivariate Clustering to
Characterize Ecoregion Borders." Computing in Science &
Engineering, Vol. 1, No. 4, pp. 18-25.
- Hoffman, F. M. and W. W. Hargrove. June 28-July 1, 1999. "Multivariate Geographic Clustering Using a
Beowulf-style Parallel Computer." In Proceedings of the
International Conference on Parallel and Distributed Processsing
Techniques and Applications (PDPTA '99), Volume III, H. R. Arabnia,
Ed. ISBN 1-892512-11-4, CSREA Press, pp. 1292-1298.
- Hoffman, F. M. and W. W. Hargrove. Spring 1999. "Cluster Computing: Linux Taken to the Extreme." Linux
Magazine, Vol. 1, No. 1, pp. 56-59.
- Hoffman, F. M. and W. W. Hargrove. May 1998. "Making
Soup from Stones." Troubleshooting
Professional, Vol. 2, Issue 5.
During the summer of 2000, I had two students, Randy Debasa and
Andrew Obeng. Randy and Drew helped us work on our statistical clustering applications on the Stone SouperComputer. I have also worked with
Stephanie Gripne, Luojian Chen,
Andrew Schultz, and Morgan Johnson. I gave an occasional guest lecture in Computer Science at the University of Tennessee. I have also enjoyed working with Matt Fitzpatrick and Jitu Kumar
Our research was prominently featured at the ORNL booth during the Supercomputing '99 Conference, and we
presented a technical paper in
which we interconnected three supercomputers to solve a single problem using Globus.
In June 2000, I was invited to attend a Workshop on
Scientific Applications of Synthetic Aperture Radar (SAR)
Satellites.
In March 2000, I was invited to speak at the annual Horizon
Days event held by the Computer Science Department at
Indiana University. My talk
was well-received, and I was flattered to have been selected as a guest
speaker.
In December 1999, I was invited and sponsored to attend a
workshop at the International
Institute for Applied Systems Analysis in Laxenburg, Austria on
Harnessing
Remote Sensing to Accomplish Full Carbon Accounting. Here is the
final report from the workshop.
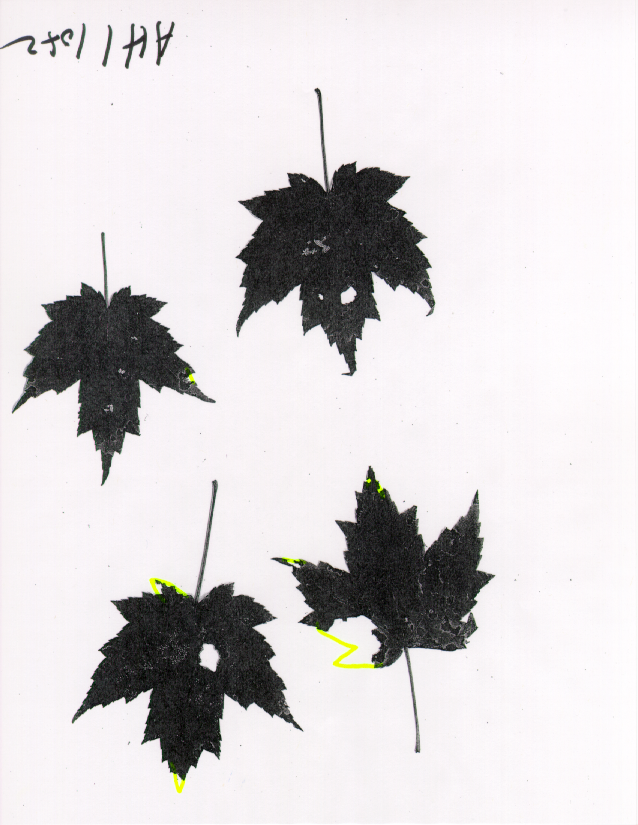
Here are some publications from my graduate work at the Coweeta
Hydrologic Laboratory Long-Term Ecological Research Site in
North Carolina, USA. In a tip-of-the-hat to my old UGA graduate
student days, I have developed a Visual Basic macro for a commercial image
analysis package, SigmaScan Pro, that can autonomously measure the amount and
percentage of leaf area that has been eaten by folivorous insects.
The program can automatically process all leaf images on xeroxed
sheets of leaves whose margins have been redrawn with a yellow highlighter
pen wherever they have been interrupted by insect feeding. Every
hole is measured on every leaf, and the
percent leaf area removed (% LAR) is calculated and stored
in a spreadsheet. Separate tallies of marginal holes
and embedded holes are kept, since these may represent
distinct feeding guilds of folivorous insects. Here is a video
(long download!) showing how quickly the leaf macro can measure leaves on
a rather ordinary computer. I am distributing the leaf macro freely;
contact me if you are interested in using it.
We have continued to develop our Multivariate Geographic Clustering
(MGC) for more than a decade, first for quantitative ecoregions,
then network analysis, and now the ForeCASTS project, which projects
present range and future range shifts for many tree species.
Two perspective views
of maps of our
ecoregions of the conterminous United States, colored in similarity
colors, show off this work very well. One of these was used as the cover
of a new geography textbook, McGraw-Hill’s
sixth edition of Cartography: Thematic Map Design, authored
by Borden Dent, Torguson, and Hodler. Also, the first edition of Exploring
Geology, authored by Reynolds, Johnson, Kelly, Morin, and Carter
highlights the map in a chapter asking, “How Does Geology Influence
Ecology?” We have also applied this same MGC through time to analyze the output of Global
Climate Models (GCMs).
Here is a picture of me with my Forest Service colleagues, Steve
Norman and Bill
Christie, who helped me to develop the ForWarn forest
disturbance early warning system. Other pictures of me with colleagues
are here and here
and here and here.
The ForWarn Early
Warning System produces sets of national maps showing potential forest
disturbances at 231m resolution every 8 days, and posts the results
to a web Assessment
Viewer for examination. The EFETAC/WWETAC ForWarn system provides
a strategic national overview of potential forest disturbances,
identifying and directing attention and resources to locations
whose forest behavior seems unusual or abnormal. The purpose
of ForWarn is to alert, focus and direct ground and aircraft
observation efforts, resulting in maximum utility and effectiveness.
It has been operating continuously since January 2010, and results
show ForWarn to be a robust and highly capable tool for detecting changes
in forest conditions.
ForWarn detects most types of forest disturbances,
including insects, disease, wildfires, frost and ice damage, tornadoes,
hurricanes, blowdowns, harvest, urbanization, and landslides. It also
detects drought, flood, and temperature effects, and shows early and
delayed seasonal vegetation development. Described initially in a cover
highlight article in Photogrammetric Engineering and Remote Sensing
(PERS), the flagship journal of the ASPRS professional
Remote Sensing society in October of 2009, and invited by
current Forest Service Chief Tom Tidwell as the subject of a “Conversations
with the Chief” talk in July 2011, the ForWarn system had an official
unveiling and rollout in March 2012, initiated by a joint
NASA and USDA press release, followed by a series of
training webinars. Almost 60 early-adopter state and federal forest
managers attended at least one of the ForWarn rollout webinars.
We are using an 11-year MODIS-based NDVI greenness phenology to
track the health of forests nationwide. Using temporal unmixing methods,
separate national maps of evergreen and deciduous forests can be produced.
A trend analysis on these separated evergreen and deciduous forests shows
locations where these forests are thriving or declining over the last
decade. Such national
evergreen and deciduous decline maps show disturbances from multiple
insect, disease, abiotic and anthropogenic factors causing chronic or
lasting decline in these forests, including hemlock wooly adelgid,
mountain pine beetle, wildfire, tree harvest, and forest conversion
for urbanization.
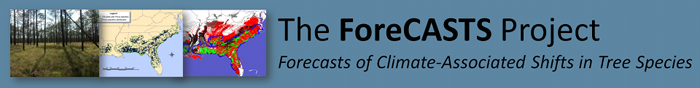
The Forecasts
of Climate-Associated Shifts in Tree Species (ForeCASTS)
system predicts
global range shifts for over 215 tree species due to climatic
changes. ForeCASTS uses a new implementation of our
statistical multivariate clustering to model tree range maps globally,
for present and multiple alternative future climatic regimes. Using the
FIA and GBIF databases, we have produced tree range predictions for
many tree species under present conditions, as well as under future
conditions predicted by 2 GCMs (PCM and Hadley) under 2 scenarios
each (A2 and B2) at two future dates (2050 and 2100). The predicted
range maps are global in extent. Resulting maps are available at http://www.geobabble.org/~hnw/global/treeranges3/climate_change/atlas.html.
This new approach allows modeling range shifts for many more tree species
than ever before, and at global rather than regional spatial extents.
Most species' predicted
suitable (or fundamental) ranges closely follow or are slightly
more extensive than their actual (or realized)
ranges under present conditions (as compared to Elbert
Little’s tree range maps). Areas
of suitability loss, degree of range overlap, and areas of range
extension can easily be seen for any model/scenario/date combination.
We have also developed a new climate change impact analysis method, Minimum
Required Movement (MRM) Distance. MRM distance determines how far a
species would have to move in order to arrive at the nearest location with
the same combination of conditions they had prior to a climatic change.
Global maps showing MRM distance to return to the closest geographic
locations offering suitable conditions in the future directly show
the likelihood of local extirpation following climate change.
Locations that are the nearest "lifeboats" for large surrounding areas
may represent management and conservation targets.
Resource managers, land-use planners and conservation organizations can
view ForeCASTS future host range maps for many tree species.
ForeCASTS already covers many more tree types than earlier
tree-shift climate change efforts. Although the Version 3 future range
maps in the atlas are still considered provisional, results for several
tree species have already been used in planning for several NFs (Francis
Marion and Sumter NFs) and several states (NC, Linda Pearsall, NCDENR,
and WA and OR, Carol Aubry, USDA FS, Olympic NF). We anticipate that Version
4 of the ForeCASTS species atlas will
contain predicted future host range maps for more than
325 tree species, covering essentially every woody species
whose home range extends into the conterminous United States. Version
4 is expected to be completed and available to managers by early
FY2013.

A $434 million project funded by the National Science
Foundation (NSF) is poised to usher in a new era of
large-scale environmental science. The project, called the National
Ecological Observatory Network (NEON), represents the most ambitious
U.S. attempt to assess environmental change on a continental scale. In
2010, NSF’s oversight body, the National Science Board, gave its final
approval to NEON, and in 2012, NEON,
Inc. started construction at the first two NEON sites. Within 5
years, if all goes well, an 8-meter steel tower will be constructed in
each of 20 different ecosystems across the country, bearing instruments
that will make it possible to compare each environment with the others.
I was fortunate to have been able to make a contribution toward
NEON by helping to delineate the 20 national NEON
domains that control the spatial deployment of the Observatory (map
of NEON domains).
I have a proturan species named after me, Eosentomon hargrovei
Bernard. As an entomology graduate student, I collected Collembola
and other soil microarthropods from the Savannah River Site near
Aiken, SC for a couple of years as a graduate assistantship.
My collected material contained lots of new, undescribed species,
and Ernest C. Bernard named one
of the new protura that he described after me. Proturans are the most
primitive Order of insects, and probably shouldn't have even made the cut.
They have simple eyes, and use their first pair of legs as antennae, since
they have none of those (see movie of an
Eosentomid Proturan walking). Protura have no economic significance
whatsoever, and probably little ecological significance either. But,
unless/until someone revises the subfamily Eosentomidae, I'm granted a
certain immortality.
In 1979 I sailed across the Pacific Ocean aboard the square-rigged
sailing ship "Eye
of The Wind" as part of an expedition called Operation
Drake (also here).
The ship sailed around the world to commemorate the circumnavigation
by Sir Francis Drake. The "Eye" is
an historic
square-rigged brigantine gaff-topsail schooner, and is 100
feet long, has 12 sails, and carried a crew of 38 people.
Here is the sail plan, info on handling the sails, and the belaying pin rail
map for the foredeck, the
foremast, the main mast, and the afterdeck. Everyone on board had these
completely memorized, and could run to the right line in the dark. It was
quite
an adventure. I joined the crew on the Atlantic
side of Panama, went through the canal, then sailed to
Costa Rica, Galopagos Islands, then Tahiti, then across
to Fiji. I got off in Fiji, four months later. Here are a bunch of my long-lost photos from the trip. A series of stamp
first-day covers were issued to commemorate the Pacific
Ocean crossing. I got to know HRH the Prince of Wales, who was
the patron of the expedition, during the trip. Here is a video of the
Eye being sailed more recently (and much more luxuriosly
than we did!), as a luxury cruise rental available from the current owners.
I am interested in Ancient Mayan Glyph
writing. Here is one way to write my
name in Mayan glyphs. We spent our honeymoon in Belize
and Guatemala looking at Mayan ruins.
I went with Dr. David Stuart to
Palenque for two weeks with my father in 2009, and it
was an awesome experience.
We were able to descend into the secret
stairway of the Temple of the
Inscriptions and see the tomb
of Pacal the Great firsthand. I am
translating the inscription from a Mayan
cylinder vase owned by the Art Institute
of Chicago ("unrolled" here), Kerr
Number 635, from the site of Naranjo that was used for
drinking frothy chocolate. It was painted around 745 AD by a
royal scribe prince known as "aj Maxam," or "the guy from Maxam,"
and here is my full translation.
Judging by the calligraphic hand, I believe that vases K633
and K2796
were almost certainly painted by the same artist, although the composition
and treatment for each are totally different.
I am also interested in early Paleontology, especially the Burgess
shale fossils, shown here in diorama.
Opabinia is perhaps the best-known of the
Burgess shale fauna, but anomalocaris
was a huge predator with radial teeth. I am also interested in the
Vendian
animals, shown here in diorama.
I was finally able to make a Canadian trip and hike up to Walcott's quarry to see the
Burgess Shale site firsthand.
My hobbies include collecting and wearing loud, colorful
(hawaiian,cubavera,camp,dragon,disco,embroidered,fishing) shirts and I
also have a minor addiction to ships-in-bottles. I collect silver-age
comic books, especially Gold Key. I also like to shop on Ebay and
at Goodwill, and I have a large collection of reggae, soca, calypso,
Caribbean, cuban, latin and african vinyl records (yes, analog!).
Otherwise, my hobby is writing unfunded proposals to work on invasive
species using niche modeling or parallel interpolation of
Forest Inventory Assessment Data productivity. If you are a sponsor,
feel free to contact me about funding this research!
I'm interested in the history of early flight, particularly the
activities of aviation pioneer Gustave Whitehead, who may have constructed
and flown a powered aircraft well before the Wright brothers (albeit with
limited control). In this picture, Whitehead
poses with his daughter, Rose, and an engine of his own design
and construction below the wing of one of his aircraft, Number 21.
He sequentially numbered all of the aircraft that he built. Unlike the
Wrights forward elevator concept, Whitehead's
designs used the layout of modern aircraft, and were steered
using differential power from the separate engines for each propeller.
Here is Whitehead holding his 1902-3 engine,
weighing 45 lbs, easily under one arm. It developed 10 horsepower,
and had an aluminum crankcase. The cylinder head is covered with loops
of copper wire for cooling. The modified bicycle wheel flywheel in
the background has had blades added between the spokes. In 1908, he
built this
airplane with Beach, but it never flew. Here are more
pictures of Whitehead and his early aircraft.
I like my Forest Service job with EFETAC, because
I feel like I'm searching for the missing pieces to bridge between research and the applied
community of forestry practitioners. This noble activity
is not without its dangers
and risks, and sometimes feels like riding on the wall-of-death with a
lion in the sidecar. And sometimes the outcome is somehow less desirable than I originally imagined.
But I strongly believe that there is a vast, fertile plain between what
is possible and what is routinely done. And I never know where this
endeavour will take me next.
Click here
(Google) for an up-to-the-minute listing of my professional pages
on the World Wide Web.
GEOBABBLE! - Geographic
Research using High Performance Computing - Watch this space for new
developments!


William W. Hargrove / hnw@geobabble.org
Last Modified: Mon Aug 13 17:17:41 EDT 2012

