
William W. Hargrove, Forrest M. Hoffman1, and Rebecca A. Efroymson1
A Practical Map-Analysis Tool for Detecting Dispersal Corridors
Reference: Hargrove, W.W., Hoffman, F.M., and Efroymson, R.A. "A Practical Map-Analysis Tool for Detecting Dispersal Corridors", Landscape Ecology and Wildlife Habitat Evaluation: Critical Information for Ecological Risk Assessment, Land-Use Management Activities, and Biodiversity Enhancement Practices, ASTM STP 1458, L. Kapustka, H. Galbraith, M. Luxon, and G.R. Biddinger, Eds., American Society for Testing and Materials, West Conshohocken, PA, 2004.
Abstract: We describe the Pathway Analysis Through Habitat (PATH) tool, which can predict the location of corridors of movement between patches of habitat within any map. The algorithm works by launching virtual entities that we call "walkers" from each patch of habitat in the map, simulating their travel as they journey through landcover types in the intervening matrix, and finally arrive at a different habitat "island." Each walker is imbued with a set of user-specified habitat preferences which make its walking behavior resemble a particular animal species. Because the tool operates in parallel on a supercomputer, large numbers of walkers can be efficiently simulated. The importance of each habitat patch as a source or a sink for a species is calculated, corresponding to existing concepts in the metapopulation literature. The manipulation of a series of contrived artificial landscapes demonstrates that the location of dispersal corridors and relative source and sink importance among patches can be purposefully altered in expected ways. Finally, dispersal corridors are predicted among remnant woodlots within three actual landscape maps.
Keywords: colonization, connectivity, fragmentation, heterogeneity, landscape ecology, matrix, metapopulation, network, patch, preserve design, sink, source
Introduction
The importance of corridors for wildlife movement in the conservation and management of biodiversity is acknowledged widely, both from a theoretical perspective (Forman 1983, 1995; Dramstad et al. 1996), through simulation approaches where corridors are already defined (e.g., Anderson and Danielson 1997), and in a number of empirical studies where corridors have been purposefully created. Such studies usually distinguish between habitat patches that are suitable for the focal species and the rest of the environment, often called the matrix.
One definition allows a corridor to be a commonly traversed route within a single habitat patch. Corridors thus defined can be studied as existing anthropogenic corridors like fencerows (Riffell and Gutzwiller 1996) or as contrived clearcuts created within a forested matrix (Haddad and Baum 1999, Haddad 2000, Tewksbury et al. 2002). Using three experimental landscapes clearcut into a loblolly forest matrix, Haddad and Baum (1999) found that the presence of clearcut corridors had dramatic effects on two species of open-habitat butterflies. Working at the same experimental site, Danielson and Hubbard (2000) found that the presence of cut corridors only weakly decreased the probability that old-field mice, Peromyscus polionotus, would disperse from a patch. The 32-m wide corridors in the study may have themselves represented patches of usable habitat for the mice.
Dunning et al. (1995) found that corridor configurations improved the ability of Bachman’s Sparrow (Aimophila aestivalis) to find and settle in newly created patches, suggesting that, for species that do not disperse easily through inhospitable landscapes, habitat occupancy at a regional scale can be enhanced by careful landscape design and planning. Sisk and Haddad (2002) translated the theoretical benefits of corridors into recommendations for management practices.
Forman (1995) and Dramstad et al. (1996) suggested that corridors may serve as a drift fence, filtering individuals from the inhospitable matrix habitat and funneling dispersers into some patches. Isolated patches may be shielded by such a corridor-patch complex, and thus receive fewer dispersers than they might otherwise receive. Haddad and Baum (1999) found that a drift-fence effect occurred in the clearcut patches, differentially concentrating some species of open-habitat butterflies. Danielson and Hubbard (2000), however, detected no drift-fence concentration effect for P. polionotus within the same experimental clearcut patches.
Here we ignore movement within habitat patches, and define corridors as connecting different patches of habitat, running between them as a pathway through the matrix. This alternative definition of corridors highlights habitat suitability not as a binary attribute, but as a continuum of usability. This definition of corridors is consistent with the theory of island biogeography (MacArthur and Wilson 1967), graph theory (Cantwell and Forman 1993), and the metapopulation concept (Levins 1969).
A metapopulation is a number of discrete local breeding populations occurring in spatially separated habitat patches connected by migration (Hanski and Gilpin 1997). Local population dynamics occur on a fast time scale in comparison with inter-patch dynamics. Pulliam (1988) distinguished "source" patches from "sink" patches, based on whether emigration from a habitat patch exceeds immigration, or vice versa, at equilibrium. A source patch has a positive local recruitment rate (birth minus death) in the absence of immigration, and thus provides a net surplus of emigrants. By Pulliam’s (1988) definition, a sink population may decline to a low but positive reproductive equilibrium in the absence of immigration. Other researchers define sinks as populations that would go extinct in the absence of immigration. A large proportion of a metapopulation can exist in sink habitats, if the source patches are sufficiently productive to subsidize the sinks. Pulliam and Danielson (1991), Pulliam et al. (1992), and Pulliam (1996) offered empirical evidence for the existence of such landscape-level, source/sink population dynamics.
Currently, no analytical tools exist which can predict comprehensively where dispersal corridors are likely to exist in real-world landscape maps. Island biogeography and graph theoretic approaches consider only the distance between habitat patches, without considering the spatially explicit impedence of the matrix to movement. Diffusion equations (Okubo 1980) and percolation analysis (Stauffer and Aharony 1992) can simulate a dispersal wave of organisms or an epidemic moving through a heterogeneous matrix, but cannot incorporate interactions like differential animal feeding and mortality.
In a seminal paper, Gustafson and Gardner (1996) developed a Monte Carlo individual-based dispersal model using self-avoiding random walkers to measure immigration and emigration rates between habitat patches within a heterogeneous landscape matrix. Large numbers of dispersing individuals of a modeled organism were simulated as walkers traversing a land cover map from one habitat patch to another. Probabilities of movement into each land cover type were varied to reflect habitat preferences of the target species. Visualizations showed the visitation frequency of successful dispersers for each grid cell in the map.
Using random walkers, Gustafson and Gardner (1996) were able to quantify the exchange of dispersing individuals across the landscape. Their random walker model could determine instantaneous connectivity as in percolation analysis (Stauffer and Aharony 1992), while using movement preferences as in an individual-based model. Gustafson and Gardner (1996) found that transfer rates between two patches in each direction often were not symmetrical, because of the funneling effect of certain landscape patterns.
While they were able to measure the patch-to-patch flow of dispersers, Gustafson and Gardner’s visualization of corridors on the landscape proved equivocal. Gustafson and Gardner (1996) concluded that "corridors are diffuse and difficult to identify on the landscape." Processing time for the computationally intensive Monte Carlo walker model also proved to be problematic. The serial code took 4 hours on a contemporary workstation to process a realistic 200-by-200 cell landscape in which the habitat patches had been simplified. Use of the random walker method for large, complex, realistic landscapes in a management context was impossible. Their initial tool was experimental rather than practical.
Here we report the development of a practical Pathway Analysis Through Habitat (PATH) tool for the detection of corridors in complex realistic landscapes. Based on random walkers, the PATH tool runs in parallel in order to provide the computational efficiency needed to analyze large landscapes with many habitat patches. Three products are produced by the PATH tool: (1) a map of the most heavily traveled movement pathways between patches of each analyzed map category, (2) a square transfer matrix quantifying the flow of animals successfully dispersing from each patch to every other patch, and (3) a set of importance values for every patch in the map which quantifies the contribution of that habitat to successful animal movement across the map. The transfer matrix is square and not triangular, since the rate of animal movement is likely to be asymmetrical between any two habitat patches. An importance value is calculated for each patch in the sense of Pulliam’s (1988) source/sink population concept. Exchange of individuals among patches is used to calculate a source importance and a sink importance for each patch. Patch importance is given in the form of both a matrix of flow and a color-coded patch map.
Methods
The Corridor Detection Method
Our algorithm works by launching virtual walkers from each patch of habitat in the map, simulating their travel as they journey through land cover types in the intervening matrix, and finally arrive at a different habitat "island." Each walker is imbued with a set of user-specified habitat preferences which make its movement behavior resemble a particular animal species. Because the PATH tool operates in parallel, large numbers of walkers can be efficiently simulated.
Habitat patches are the landscape unit of concern, and all patches are treated equally, regardless of their area. Only walkers which successfully disperse (i.e., which actually reach another patch of habitat) are retained. After walkers have been launched from all habitat patches, the collected footprints of all successfully dispersing walkers are inversely weighted by the energy used, and summed so that their combined tracks show the most heavily-used pathways of movement across the map.
An ASCII map of the land cover or habitat categories must be supplied as input to the PATH tool. A second ASCII map in which the individual, spatially contiguous patches of each category are encoded must also be supplied. The user supplies four types of additional habitat-specific information: preferences for being in each type of habitat, energy costs of movement through each type of habitat, likelihood of finding food in each habitat, and likelihood of mortality (other than starvation) in each type of habitat. The PATH tool allows multiple species of walkers, or separate preference specifications for each sex or different life stage of the animal being simulated.
Each walker is started at a random cell within its "birth" patch, and is given a fixed amount of energy proportional to the size of the map. A "hotfoot" routine makes the birth patch distasteful, encouraging walkers to leave home quickly and never return. Walkers which return to the birth patch are killed, and are not included in the tabulation of dispersers.
An "anti-vibrate" routine discourages walkers from abrupt reversals by decreasing probability of movement back to their last position. Probabilities of moving to the two subcardinal locations on either side of the last position are also decremented, giving the walkers some directional momentum for added realism.
Three exclusive options are provided for the behavior of walkers at map edges: walkers encountering an edge can (1) die and have their tracks eliminated, (2) experience the edge as a wall, or (3) cross through the edge to re-enter the map on the far side. This last option wraps the map like a torus in two directions. Thus, the map appears infinite to walkers, eliminating the effect of edges on the corridors. While not likely to be useful in practice, the option can be used to test for the presence of an edge effect.
Only walkers that successfully reach another patch of habitat are tabulated. Walkers may fail to disperse because they re-enter their birth patch, encounter the map edge under the edge-die option, or because they exhaust their movement energy.
Additional walkers are started from a patch until a user-determined number of walkers have successfully dispersed. Each node of a cluster computer is assigned a birth patch from which to send walkers in parallel. A fixed success quota keeps the sampling intensity constant, giving all patches an equal chance to contribute to the formation of dispersal corridors.
A computer node may be assigned a patch which is surrounded by a barrier, or is particularly disconnected from the other patches. To prevent the node from endlessly sending walkers, it aborts that patch after sending a certain number of walkers without attaining the success quota. The "abort quota" is like the detection limit for an analytical device, except that it is under the user’s control. A patch which has reached the abort quota has less than the specified Minimum Success Ratio (MSR), and therefore has a level of connectance which is less than the detection limit.
Calculating Source and Sink Importance of Habitat Patches
Source and sink importance for a patch are calculated in independent ways. Source importance is calculated as the ratio of successful dispersers originating in the patch to the total number of walkers (whether successful or not) sent from the patch. Successful walkers originating from aborted patches are counted toward source importance even though the MSR for that patch is not met. Sink importance for a patch is calculated as the ratio of successful dispersers ending up in the patch (having started from some other patch) to the number of all successful dispersers originating from all habitat patches. Successful dispersers from aborted patches make no contribution to sink importance.
Concepts of source and sink importance, as used here, can be succinctly stated in four axiomatic rules:
1. Successful walkers from each patch (including aborted patches) contribute to the source importance of their birth patch.
2. Successful walkers from each patch do not contribute to the source importance of any other patches.
3. Successful walkers from each patch do not contribute to the sink importance of their birth patch (i.e., walkers die if they return to their birth patch).
4. Successful walkers from each patch contribute to the sink importance of other patches only if the MSR for their birth patch is met (i.e., successful walkers from aborted patches are not counted).
As a result, traversals from aborted patches count only toward the source importance of their birth patch; they make no contribution to the sink importance of other patches (see rule 4). No footprints of walkers from aborted patches are used in the corridor map.
Summing Footprints of Successful Walkers to Form Maps of Corridors
Before they are summed, footprints of successfully dispersed walkers are weighted inversely by the square of the energy expended during their traversals. Thus, the most efficient traversal paths contribute more strongly to defining the most probable corridors. Footprints of walkers from each patch are accumulated, and the subset of corridors leading from each patch can be examined individually if desired. Corridor intensity from each patch is normalized before summing the corridors from all patches together, so that all patches contribute equally to the final map of landscape corridors.
Results
Experiments with Simple Artificial Landscapes
We tested the behavior of the PATH tool on simple artificial landscapes designed so that the geographic arrangement of dispersal corridors would be intuitively predicted. No patches were aborted in any of the artificial landscapes. These test landscapes have a largely homogeneous matrix, with only a few intervening land cover types contrived to direct dispersal corridors in some expected way. Corridors through complex landscapes are not likely to be as intuitive, but will be accepted more readily if the tool has shown appropriate behavior with simple, designed landscapes. Land managers will need to experience such confidence-building experiments before fully vesting in the tool, so these efforts are important for acceptance and use.
Figure 1 shows a landscape containing five, equal-sized patches of suitable habitat arranged like the side of a die within a homogeneous matrix. Walkers die if they touch the edge of the map. In this spatial configuration, diagonal pathways involving the center patch are the shortest, and are therefore detected as the strongest corridors, although vertical and horizontal pathways are also present, appearing as lateral blue wings on Figures 1D, E, and G. As expected, the center patch is both the most important source and the most important sink.
Figure 2 shows the same landscape as Figure 1, but with the edge-wrap option set, so that walkers leaving any map edge reappear on the opposite side of the map. The strongest corridors are now between the corner patches, especially in the top-to-bottom direction. Figure 2B and C show that corner patches are slightly closer to the edges vertically than horizontally, making the top-bottom connections the strongest corridors.
Figure 3 shows the effect of removing the center habitat patch with the edge-die option set. Strongest corridors are detected horizontally (the shortest path), and strong corridors are also detected vertically. The yellowish hole in the middle indicates that somewhat weaker diagonal corridors are also present, and these diagonal pathways are visible in Figure 3D through G.
Figure 4 establishes a reference landscape to evaluate the effects of introducing a second land cover type within the intervening matrix between habitat patches with the edge-die option set. With a homogeneous matrix, the three main corridors form a triangle, with slight disperser concentrations just inside each of the habitat patches. The two top patches are slightly stronger sources, while the single bottom patch is a slightly stronger sink, because of the triangular arrangement of the patches in the landscape.
When a diagonal dispersal barrier is introduced into the matrix of the landscape in Figure 4, dispersers concentrate asymmetrically in corridors along the bottom side and off the free end of the barrier (Figure 5). The barrier funnels dispersers preferentially between the top right patch and the bottom patch (Figure 5E and F). As a result, the upper right patch becomes the strongest source, while the bottom patch becomes the strongest sink. This landscape illustrates the drift-fence phenomenon of Forman (1995) and Dramstad et al. (1996).
Figure 6 shows how corridors are affected by four barriers forming a paired funnel configuration. Intense corridors are formed along the upper surfaces of each funnel, and in the throat. The barriers improve top-to-bottom connectivity by directing dispersers toward appropriate patches, while leaving horizontal connectivity unchanged. Consequently, the paired top patches are the strongest sources, while the bottom patch is the strongest sink. Corridors predicted for many other contrived artificial landscapes can be seen at http://research.esd.ornl.gov/~hnw/walkers.
Detecting Corridors in Realistic Landscapes
We obtained the three realistic landscapes from the Kankakee River area in northwestern Indiana that Gustafson and Gardner (1996) used in their study. These landscapes show remnant fragments of deciduous forest within a predominantly agricultural matrix. Derived from Landsat TM images, they contain 11 land cover types, and were simplified to reduce the total number of habitat patches. We used the habitat preferences of a hypothetical species that Gustafson and Gardner (1996) specified in their maximum heterogeneity case, so that preference increases from water, road, dry bare soil, bare soil, moist bare soil, young row crop, short grass, medium grass, tall grass, conifers, and deciduous forest (see Table 3, Gustafson and Gardner (1996) for probabilities).
PATH was used to determine corridors among deciduous woodlots within the "MINE" landscape (Figure 7). Strong corridors run along the edges of the ponds. Dispersers are particularly concentrated along the southern edge of the lower pond, as they pass between the lower habitat patches. This is not the only corridor between these patches; a more diffuse, dendritic pattern can be seen favoring the tall grass in the matrix. The patches to the east of the ponds are connected by distinct pathways on both sides of the road curving downward from the gravel pit. The corridor to the east of the road is tenuous, following the tall grass. The corridor along the west side of the road is broader and stronger. The large patch in the southwest corner is poorly connected to the group of three patches in the northwest.
Strong, short corridors exist between the three northwestern patches, and between the two patches in the southeastern group, despite the presence of the road. The largest southwestern patch is the poorest source, but the northeastern patch is the poorest sink. If the gravel pit operation destroyed any deciduous forest habitat patches, or if it created the ponds, it is likely that it substantially reduced the connectivity between the northwestern patches and the southeastern habitat patches for species migrating through this landscape.
Several large patches are divided by water in the "RIVER" landscape, shown in Figure 8. Even though water is the least preferred cover type, strong corridors still exist through the river, because of the proximity of these habitat patches. Inter-patch distance does not fully explain corridor development, however. The two patches in the northeast corner are about as far apart as the two largest patches in the southeast corner, yet the former are well-connected by short grass along the shoulders of a roadside. The habitat patch in the northwest corner is poorly connected to the other patches, since a wide area of drier bare soil isolates it, making it the weakest source and sink.
Grass growing along roadsides and section lines enhances connectivity across forested patches in the "AGRI" landscape (Figure 9). Corridors to the top habitat patch in "AGRI" are very interrupted and diffuse, making this patch one of the weakest sources and sinks in the map. The large grassy area between this top patch and the largest patch serves to dilute dispersers, even though the grass land cover is preferred.
Figure 1--Corridor results within a contrived artificial landscape containing five habitat patches arranged within a homogeneous matrix. The edge-die option is set. Dark red paths are densest, through cooler colors to black. Diagonals involving the center patch represent the strongest corridors between habitat patches (A), but vertical and horizontal corridors are also present. The center patch is the most important source (B), and also the most important sink (C). D through G show corridors leading from four of the individual habitat patches, and H through K show example tracks of successfully dispersing walkers, weighted by the inverse of squared track length.
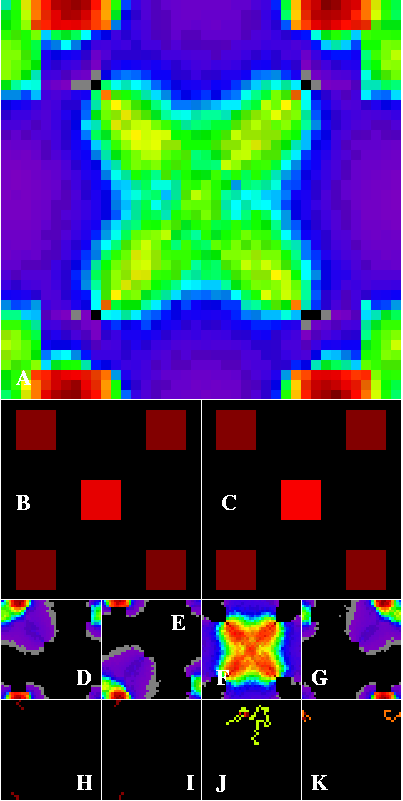
Figure 2-- Corridor results within a contrived artificial landscape containing five habitat patches arranged within a homogeneous matrix. The edge-wrap option is set. Dark red paths are densest, through cooler colors to black. Top-to-bottom wrapping pathways between corner patches now represent the strongest connections between habitats (A), but the left-to-right connection is also present, as are the diagonals involving the center patch. The four corner patches now have the highest source importance (B) and sink importance (C). D through K are defined in Figure 1.
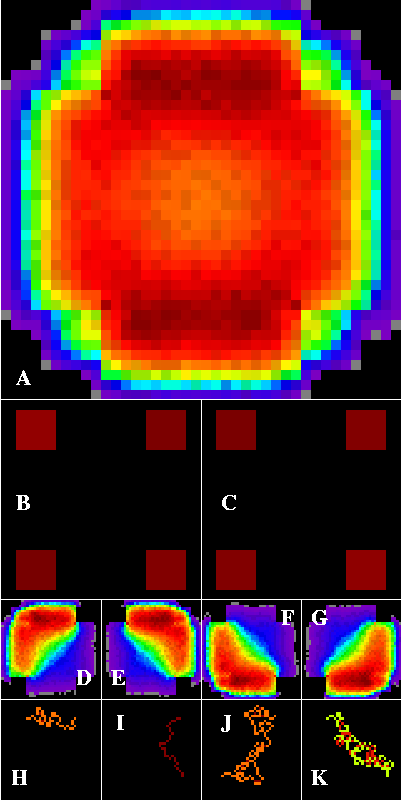
Figure 3--Corridor results within a contrived artificial landscape containing four habitat patches arranged within a homogeneous matrix. The edge-die option is set. Dark red paths are densest, through cooler colors to black. This landscape shows strongest horizontal corridors, but also shows strong vertical corridors and weaker diagonal corridors (A). All four patches are roughly equal in source importance (B) and sink importance (C). D through K are defined in Figure 1.
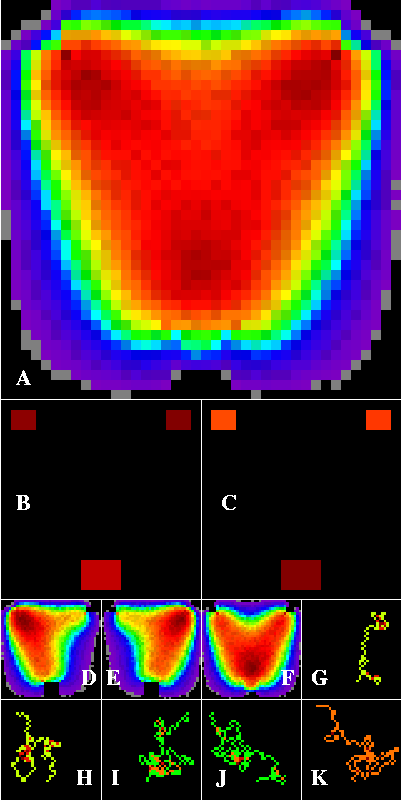
Figure 4--Corridor results within a contrived artificial landscape containing three habitat patches arranged within a homogeneous matrix. The edge-die option is set. Dark red paths are densest, through cooler colors to black. Corridors detected in this landscape form a heart or triangle, and are densest just inside each habitat patch (A). The two top patches are slightly stronger sources (B), but the single bottom patch is a slightly stronger sink (C). D through K are defined in Figure 1.
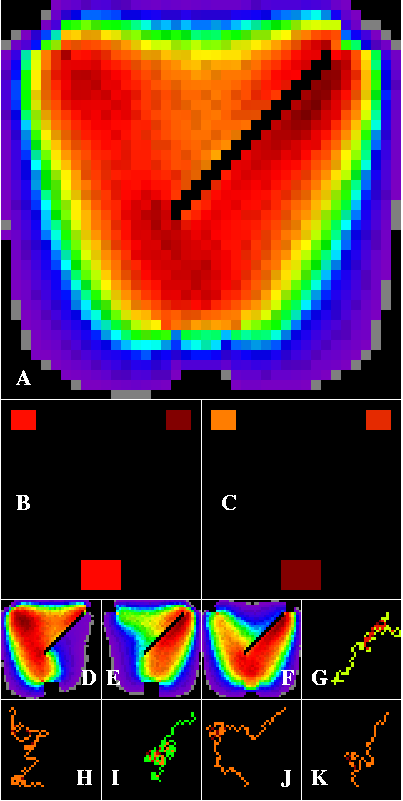
Figure 5--Corridor results within a contrived artificial landscape containing three habitat patches arranged within a heterogeneous matrix. The matrix contains a diagonal barrier to disperser movement. The edge-die option is set. Dark red paths are densest, through cooler colors to black. Corridors detected in this landscape are still roughly triangular, but now dispersers are concentrated in a corridor along the bottom and off the end of the barrier (A). The upper right patch is the strongest source (B), while the bottom patch is the strongest sink. Corridors formed from individual patches, shown in D through F, show how this asymmetry occurs. G through K are example tracks of successful walkers.
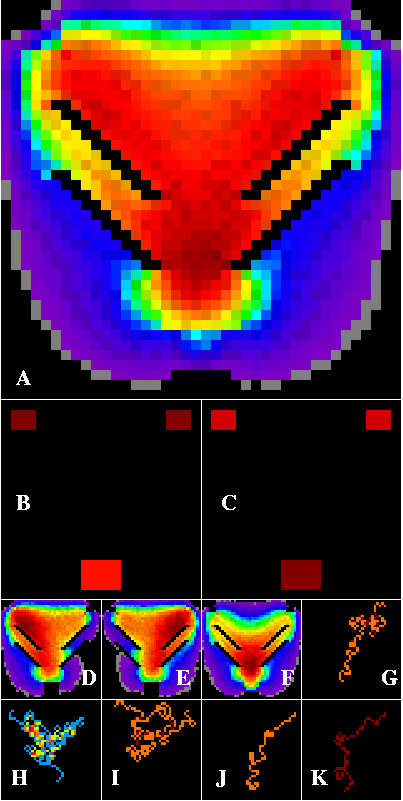
Figure 6--Corridor results within a contrived artificial landscape containing three habitat patches arranged within a heterogeneous matrix. The matrix contains paired diagonal barriers forming a nested funnel configuration. The edge-die option is set. Dark red paths are densest, through cooler colors to black. Corridors are concentrated by the barrier configuration, and are densest just above the lower patch, in the double throat of the funnel (A). The upper two patches are the strongest sources (B), while the lower patch is the strongest sink (C). D through K are defined in Figure 1.
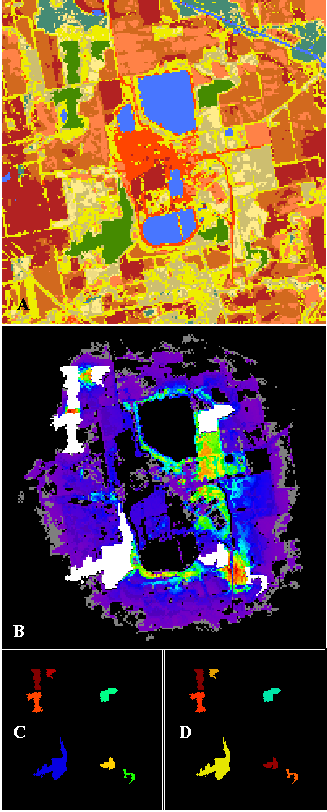
Figure 7--The "MINE" landscape from northwestern Indiana analyzed for corridors (A). Green areas are remnants of deciduous forest (representing the habitat under analysis) within an agricultural matrix. Medium blue areas are water, browns are bare soil classes, and cream colors are grass categories. Light blue areas are conifers. The red area in the center of the image is a gravel pit operation. Corridors detected among the remnant deciduous forest patches are colored as in previous figures (B). Habitat patches are shown in white, and patch source importance (C) and sink importance (D) are also shown. Landscape used with permission from E. Gustafson.
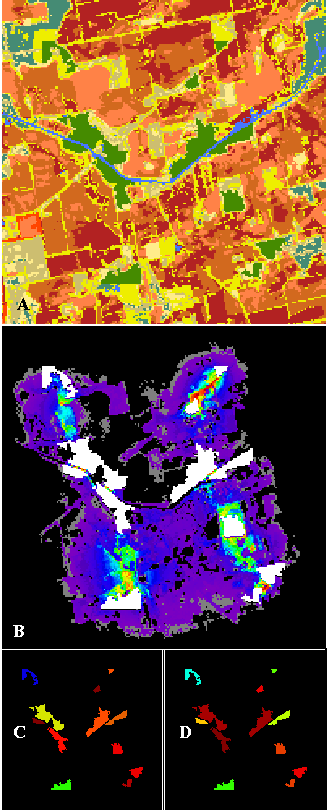
Figure 8--The "RIVER" landscape from northwestern Indiana analyzed for corridors (A). Green areas are remnants of deciduous forest (representing the habitat under analysis) in a riparian zone and within an agricultural matrix. Medium blue areas are water, browns are bare soil classes, and cream colors are grass categories. Light blue areas are conifers. Corridors detected among the remnant deciduous forest patches are colored as in previous figures (B). Habitat patches are shown in white, and patch source importance (C) and sink importance (D) are also shown. Landscape used with permission from E. Gustafson.
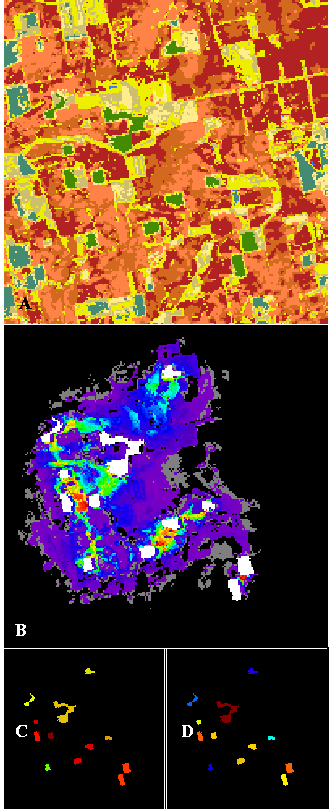
Figure 9--The "AGRI" landscape from northwestern Indiana analyzed for corridors (A). Green areas are remnants of deciduous forest (representing the habitat under analysis) within an agricultural matrix. Medium blue areas are water, browns are bare soil classes, and cream colors are grass categories. Light blue areas are conifers. Corridors detected among the remnant deciduous forest patches are colored as in previous figures (B). Habitat patches are shown in white, and patch source importance (C) and sink importance (D) are also shown. Landscape used with permission from E. Gustafson.
Discussion
Experiments using artificial landscapes indicate that managers can change relative source/sink strengths at will by altering the matrix through which dispersers must pass (Figures 3 through 5). These changes in source and sink strength can be made without changing the number, area, or spatial arrangement of the habitat patches themselves. Source and sink strengths are comparable across different maps, since they are expressed as ratios, but greater numbers of walkers produce more precise estimates. Less than one minute was required to simulate 10,000 successful walkers to detect corridors in the realistic landscapes using four nodes of a parallel computer. The weighted visualizations show distinct corridors through the realistic landscapes.
It is difficult to guess before using the PATH tool where corridors will be located on the map, or which patches will be the most important sources or sinks. In a homogeneous matrix, corridors follow the shortest paths of least resistance, as might be expected. Indeed, corridors in the artificial landscapes resemble arcs of electrical current, or magnetic lines of force. Figures 7B through 9B show purple halos surrounding all of the white habitat patches. High preference land cover types along roadsides and fencerows are evident from further away, acting as though they have stronger "radar reflectance." The heterogeneous matrix of a realistic landscape contains materials with widely different impedences, making the corridors difficult to imagine before they are predicted.
In practical use, land managers may wish to creatively pre-process the map before submitting it for corridor analysis. Conservationists interested in movements of bears, for example, should submit landscapes containing not only prime bear habitat, but also land cover categories representing nominal and sub-optimal (but usable) habitats, and should consider corridors found among all of these categories. If the target organism has minimum patch area requirements, the map should be re-coded, changing patches that are smaller than this minimum to a separate cover type which can be assigned a lower preference. Maps submitted for species requiring core areas should have the peripheral parts of all patches re-coded and assigned lower preference values. Shallow parts of rivers and narrow parts of roads can be re-coded and assigned higher movement likelihoods.
A simple diffusion equation might have sufficed to find corridors through Figures 1 through 6, in which the matrix is fairly simple (and such an equation might have been more efficient computationally!). However, it is unlikely that a diffusion equation could have been used to find corridors through the complex matrix in the realistic landscapes. Using random walkers, we can add realistic, habitat-dependent, variable energy costs, energy gains, and mortality.
Individual random walkers are not analogous to individuals of the target species. Individual bears, for example, are much smarter than random walkers, even when the walkers are imbued with bear-like movement preferences. The random walkers are used collectively in the PATH tool as a spatial optimization process. Together, walkers delineate optimum movement pathways; the same optimum pathways that we expect bears to use, because bears are well-adapted to their surroundings. Still, an individual bear might choose sub-optimally, so the process is simulated probabilistically rather than deterministically. Or, an individual bear may recall where good habitat is, or see it in the distance, behaving more optimally than the luckiest PATH walkers.
The PATH tool can be used as a "what-if" tool to evaluate prospective changes in the landscape before they are made. The spatial combination of gravel pit roads between two large ponds in Figure 7 restricts corridors from passing through this area, and substantially reduces the northwest-southeast connectivity between the remaining forest fragments. Seeing that corridors skirt the ponds, a land manager could enhance the remaining connectivity by planting tall grass along the pond edges. The PATH tool should also be useful in the design of preserves consisting of several habitat remnants.
If a habitat patch is a strong sink and a weak source, its presence may be damaging to the metapopulation. Restoration of a sink patch may actually reduce the size of the metapopulation, if the reproductive rate within that patch is less than replacement. A better conservation strategy might be to increase the patch area and improve its quality, while rearranging the matrix to discourage immigration.
One paradox comes from the treatment of habitat patches as equal units. If the area between the two nearly-touching southeastern patches in Figure 9 restored to deciduous forest, the two patches would coalesce to form a single patch. If the corridor analysis were repeated, it might show that the source importance and the sink importance of the coalesced patch had decreased, since the new single patch no longer has a nearby partner with which to exchange dispersers. Area of habitat patches is not considered, although we could also calculate importance on a per area basis, allowing a dilution of patch importance as area increases. The splitting or coalescence of patches may produce surprising results even if importance is calculated per unit area.
Corridors found using random walkers need to be validated and verified against actual movement corridors which have been experimentally observed. Radio tracking and telemetry studies should provide an opportunity for an empirical test of walker-generated corridors against observations of real species moving across actual landscapes.
Few land managers have access to a supercomputer (but see Hargrove and Hoffman 2001). We are developing a web interface for the PATH tool, so that users will have access to corridor analysis without the necessity of owning a parallel supercomputer. Users will be prompted via a web interface to submit their map, full preference parameters, and the categories in the map which are to be analyzed for corridors. When their analysis is completed, users will be able to pick up their corridor results on a special web page. The web front-end will make corridor analysis easily available to management practitioners, representing an accessible form of technology transfer.
Acknowledgments
This research was sponsored by the National Petroleum Technology Office, U. S. Department of Energy, and by the Southern Appalachian Information Node of the United States Geological Survey National Biological Information Infrastructure program, and was performed at Oak Ridge National Laboratory (ORNL). ORNL is managed by UT-Battelle, LLC, for the U. S. Department of Energy under contract DE-AC05-00OR22725. We thank Nancy Comstock, Kathy Stirling, and Daniel Gurney, NPTO project managers, and Mike Frame, NBII project manager, for their support of this project. We thank David Fowler of Oak Ridge National Laboratory and anonymous petroleum industry reviewers for comments on earlier drafts of this manuscript.
References
Anderson, G.S., and Danielson, B.J., 1997, "The effects of landscape composition and physiognomy on metapopulation size: the role of corridors", Landscape Ecology Vol.12, pp. 261-271.
Cantwell, M. D., and Forman, R.T.T., 1993, "Landscape graphs: Ecological modeling with graph theory to detect configurations common to diverse landscapes", Landscape Ecology, Vol. 8, No. 4, 239-255.
Danielson, B.J. and Hubbard, M.W., 2000, "The influence of corridors on the movement behavior or individual Peromyscus polionotus in experimental landscapes", Landscape Ecology, Vol. 15, pp. 323-331.
Dramstad, W.E., Olson, J.K., and Forman, R.T.T., 1996, Landscape ecology principles in landscape architecture and land-use planning, Island Press, Washington, DC. 80 pgs.
Dunning, J.B., Borgella, R., Clements, K., and Meffe, G.K., 1995, "Patch Isolation, Corridor Effects, and Colonization By a Resident Sparrow In a Managed Pine Woodland", Conservation Biology, Vol. 9, pp. 542-550.
Forman, R.T.T., 1983, "Corridors in a landscape: their ecological structure and function", Ekologia, Vol. 2, No. 4, pp. 375-387.
Forman, R.T.T., 1995, Land mosaics: the ecology of landscape and regions39, Cambridge University Press, Cambridge, MA
Gustafson, E.J., and Gardner, R.H., 1996, "The effect of landscape heterogeneity on the probability of patch colonization", Ecology, Vol. 77, pp. 94-107.
Haddad, N.M., 2000, "Corridor length and patch colonization by a butterfly, Junonia coenia", Conservation Biology, Vol. 14, pp. 738-745.
Haddad, N.M., and Baum, K., 1999, "An experimental test of corridor effects on butterfly densities", Ecological Applications, Vol. 9, pp. 623-633
Hanski, I.A., and Gilpin, M.E., eds, 1997, Metapopulation Biology, Academic Press, San Diego, CA.
Hargrove, W.W., Hoffman, F.M., and Sterling, T.L., 2001, "The do-it-yourself Supercomputer", Scientific American, Vol. 256, No. 2, pp. 72-79.
Levins, R., 1969, "Some demographic and genetic consequences of environmental heterogeneity for biological control", Bulletin of the Entomological Society of America, Vol. 15, pp. 237-240.
MacArthur, R.H., and Wilson, E.O., 1967, The Theory of Island Biogeography, Princeton University Press, Princeton, NJ.
Okubo, A., 1980, Diffusion and Ecological Problems: Mathematical Models, Springer-Verlag, Berlin, Germany.
Pulliam, H.R., 1988, "Sources, sinks, and population regulation", American Naturalist, Vol. 132, pp. 652-661.
Pulliam, H.R., 1996, "Sources and sinks: empirical evidence and population consequences", Population Dynamics in Ecological Space and Time, Rhoades, O.E., Chesser, R.K., and Smith, M.H., Eds., University of Chicago Press, Chicago, IL, pp. 45-69.
Pulliam, H.R., and Danielson. B.J., 1991, "Sources, sinks and habitat selection: a landscape perspective on population dynamics", American Naturalist, Vol. 137, pp. 550-566.
Pulliam, H.R., Dunning, Jr., J.B., and Liu, J., 1992, "Population dynamics in complex landscapes: a case study", Ecological Applications Vol. 2, pp. 165-177.
Riffell, S.K., and Gutzwiller, K.J., 1996, "Plant species richness in corridor intersections - Is intersection shape influential?", Landscape Ecology, Vol. 11, pp. 157-168.
Sisk, T.D., and Haddad, N.M., 2002, "Incorporating the effects of habitat edges into landscape models: Effective area models for management", Integrating Landscape Ecology into Natural Resource Management, Liu, J., and W.W. Taylor, Eds., Cambridge University Press, Cambridge, United Kingdom, pp. 208-240.
Stauffer, D, and Aharony, A., 1992, Introduction to Percolation Theory, Taylor and Francis, Washington, DC.
Tewksbury, J.J., Levey, D.J., Haddad, N.M., Sargent, S., Orrock, J.L., Weldon, A., Danielson, B.J., Brinkerhoff, J., Damschen, E.I., and Townsend, P., 2002, "Corridors affect plants, animals, and their interactions in fragmented landscapes", Proceedings of the National Academy of Sciences, Vol. 99, pp. 12923-12926.