|
William W. Hargrove, Forrest M. Hoffman, Paul F. Hessburg, Brion Salter, and Ross K. Meentemeyer
Sudden Oak Death (SOD), caused by the fungal pathogen Phytophthora ramorum, is a forest disease that has reached epidemic levels in the coastal forests of central California. The susceptibility of forests beyond the west coast of the United States to SOD is unknown, but is the subject of speculation, since the spread of the SOD epidemic could represent a serious threat to eastern forests. We present an empirical multivariate statistical modeling approach to predicting the national susceptibility of forests to the spread of SOD. The statistical basis of this empirical approach is provided by an automated delineation of national sets of quantitative SOD-relevant ecoregions, based on sets of multivariate environmental characteristics that potentially limit the range for P. ramorum, using the Multivariate Geographic Clustering (MGC) algorithm running on a parallel supercomputer (Hargrove and Hoffman 2004).
MGC uses the iterative k-means algorithm of Hartigan (1975), which begins with a user-specified number of ecoregion clusters, k, into which the map cells are to be grouped. Normalized values of each multivariate characteristic are used as coordinates to plot each map cell in an environmental space with as many axes as there are multivariate environmental dimensions. In a single iteration, each map cell is assigned to the closest (i.e., environmentally most similar) cluster centroid. At the end of the iteration, the coordinates of all map cells within each group are averaged to produce a new, adjusted centroid, and another iteration of assigning map cells to these new centroids begins. Iterations continue until fewer than a predetermined number of map cells change cluster assignments during an iteration. Two map cells that are plotted near to one another in data space will have similar mixtures of environmental conditions, and are likely to be classified into the same ecoregion cluster. Once cluster assignments have converged, map cells are reassembled in geographic space, retaining their ecoregion classifications. Although geographic coordinates are not used in the classification, MGC ecoregions tend to be geographically cohesive because of the spatial autocorrelation that is usually present in the environmental data.
As a recently described pathogen, little is known about the basic biology of P. ramorum. P. ramorum causes both lethal branch or stem infections, and non-lethal foliar and twig infections. Except for tanoak (Lithocarpus densiflora), oak species appear epidemiologically to be terminal hosts, and do not support further sporulation. Foliar hosts, such as rhododendron (Rhododendron spp.) and viburnum (Viburnum spp.), support sporulation, but sporulation and subsequent infection requires that a film of free water exists on plant surfaces for a minimum of 6 to 12 consecutive hours (Garboletto et al. 2003). Spores are dispersed by raindrop splashes.
An empirical approach using statistical clustering is ideal when the exact environmental requirements of a pathogen like P. ramorum are poorly known. Unlike with rule-based modeling approaches, it is not necessary to specify exactly the temperature or wetness thresholds limiting P. ramorum growth. It is necessary to only identify and construct surrogate variables whose environmental characteristics are likely to share the same spatial variance structure as the (unknown) variables actually limiting the range of P. ramorum. SOD-relevant ecoregions formed on the basis of these surrogates, and then "trained" using verified SOD outbreak locations, can still be used to calculate the multivariate similarity between conditions in each of the national SOD-relevant ecoregions and known SOD outbreak locations.
For an area to be susceptible to SOD, environmental conditions are required that not only support the growth of the pathogen itself, but also permit the growth of a suitable host. Although 23 plant species from 12 families have been confirmed as potential hosts (Rizzo et al. 2002a, Rizzo et al. 2002b), 10 of the 15 species most commonly associated with active sporulation of P. ramorum have geographic ranges limited to the west coast of the United States. If P. ramorum is truly limited to western species, then there is no threat to eastern forests. It seems likely, however, that eastern congeners will also act as potential hosts.
Because it remains to be seen which eastern forest species can or will act as hosts to P. ramorum, we have taken a two-step approach to predicting national susceptibility to SOD. One must not only predict the range of environmental conditions that will permit the growth of the pathogen itself, but also the range of environmental conditions that permit the growth of likely host plants supporting the pathogen.
In the first step, we include only temperature, precipitation and wetness/dryness conditions that might limit the growth of P. ramorum itself, irrespective of the presence of potential host plants. These maps, based only on growing conditions required by the pathogen alone, show all locations within the United States where the fungus could grow given a suitable medium, i.e., inoculated on a suitable host under ambient outdoor conditions. Such maps are likely to include areas as susceptible to SOD even if they have no suitable forests, if climatic conditions are such that P. ramorum could grow, and thus may overpredict SOD susceptibility. Nevertheless, we believe that the uncertainty in identifying important non-west coast host species, particularly non-lethal foliar hosts (including many ornamentals and cultivars), makes this zero-order map itself a valuable product.
Because the eastern hosts for P. ramorum are not completely known, one cannot simply mask the SOD-only prediction with maps of the geographic ranges of hosts. In a separate second step, we include all layers used in the SOD-only prediction, plus all factors restricting the occurrence of potential host plants. Added to all of the same temperature, precipitation, and wetness factors used in the initial SOD-only analysis are many additional variables describing aspects of the environment that potentially limit the distribution of suitable host plants. These include soil factors, topographic information, and effective solar insolation, along with information on existing vegetation, including enhanced vegetation index, fraction of photosynthetically active radiation, leaf area index, and information on gross productivity and respiration. This second-step prediction must be simultaneous, since both P. ramorum and a suitable host are needed for true susceptibility to occur. The operative assumption for this second predictive step is that susceptible foliar-hosts in eastern forests will occur within similar environmental conditions as the current foliar-hosts in western forests, albeit as different species acting as ecological homologs. Ours is the first SOD susceptibility study to adopt this two-stage, host-independent/host-dependent predictive approach.
Using each of these two SOD-relevant ecoregion sets, we perform two additional analyses. In the first, we calculate the multivariate similarity of each SOD-relevant ecoregion to two selected SOD ecoregions having the greatest number of confirmed SOD outbreak locations (Marin and Santa Cruz). These similarity calculations produce two national maps in which the degree of similarity is shown between biophysical conditions within each SOD-relevant ecoregion and environmental conditions associated with the worst SOD outbreaks.
In a second type of analysis, we treat all of the known SOD outbreak locations conceptually as a "network." We then quantify how similar the multivariate "signature" of SOD-relevant environmental conditions within each SOD-relevant national ecoregion is to the signature within the most-similar site known to harbor a SOD outbreak. Using these similarities to known outbreak locations, a new national map predicting SOD susceptibility can be produced. We generate one such predicted national SOD susceptibility map for each of the sets of SOD-relevant ecoregions.
We identified Vapor Pressure Deficit (VPD) as an obtainable surrogate for the leaf wetness requirements of P. ramorum to successfully sporulate and infect. VPD measures condensation potential, and is corrected for temperature and relative humidity effects. Lower VPD represents wetter conditions, and when VPD reaches zero, condensation has occured somewhere in the system. Negative VPD values indicate actively falling dew or precipitation. Thus, sufficient periods of low VPD may indicate the presence of the water film that is needed for the spread of SOD.
We used the DAYMET 18 year historical data set at 1 km2 resolution across the lower 48 United States to calculate locations that met a range of criteria for temperature, precipitation, and VPD conditions. A map was produced for each criterion that we developed and applied to the DAYMET data. Our intention was to generate a set of custom SOD-relevant environmental maps to use as input to the MGC process, dividing the nation into a set of SOD-relevant ecoregions that could then be used to predict SOD susceptibility.
A set of 45 national maps describing temperature, precipitation, and VPD wetness/dryness conditions were produced by "combing" through the DAYMET data set using different threshold criteria. This SOD "comb" accumulates data and constructs the national maps. Because we believe that SOD spread is controlled by extreme events, we generated maximum and minimum values per year over the 18 DAYMET years, rather than mean values. To prevent unusual values from having undue influence, we used the penultimate rather than the ultimate maximum or minimum values over the 18 year meteorological sequence. Because P. ramorum growth is restricted to warm temperatures, precipitation and VPD wetness/dryness criteria were tested only on days when the daylight temperature was equal to or greater than 10°C. Temperature-based criteria, however, were calculated for all DAYMET days.
From the maps produced by a wide range of VPD thresholds, a single consistent pair of overlapping thresholds were selected for VPD wetness- and dryness-based maps input to MGC (Figure 1). In addition to simple counts of penultimate maximum DAYMET days ≥10°C satisfying VPD dryness and wetness conditions during the 18 year record, we calculated maps of continuous, consecutive days below and above particular VPD thresholds. We also produced national maps of penultimate maximum runs of greater than three and greater than five continuous days wetter than the selected VPD wetness threshold. By including maps of the number of consecutive days exceeding one, three, and five day runs, we hoped to adequately describe the wetted plant surface requirements of P. ramorum for sporulation and infectivity. VPD values in DAYMET represent averages for the entire 24-hour period, resulting in larger positive values even for fairly wet conditions. It is not necessary to exactly specify the relevant dryness or wetness threshold actually limiting P. ramorum for this multivariate-similarity-based approach to successfully predict SOD susceptibility; similarity to actual outbreak locations does this automatically.
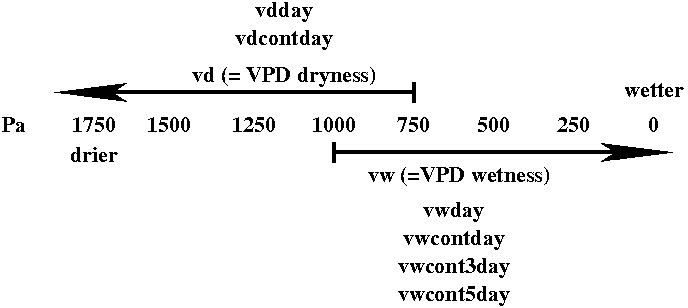 |
| Figure 1. The Vapor Pressure Deficit (VPD) scale and the two overlapping thresholds used to generate national maps of wetness and dryness conditions possibly limiting the spread of Phytophthora ramorum, the causative agent of Sudden Oak Death (SOD). |
Of the 45 maps constructed, 17 were selected for use as input to MGC on the basis of SOD relevance and spatial variability structure (Table 1). The following table describes the climatic criteria used to produce national maps of SOD-relevant conditions selected as input to the MGC process.
| Variable | Climatic Criterion Regulating Phytophthora ramorum Growth |
|---|---|
| dday | Mean degrees × days heating >0°C |
| ddayh | Penultimate maximum degrees × days heating >18°C |
| ddayc | Penultimate maximum degrees × days cooling ≤18°C |
| tday | Mean daytime (daylight) temperature |
| tmax | Penultimate maximum highest daily temperature |
| tmin | Penultimate minimum lowest daily temperature |
| psum | Penultimate maximum precipitation sum while ≥10°C |
| pday | Penultimate maximum days with precipitation (>0.3cm) while ≥10°C |
| pcontday | Penultimate maximum consecutive days with precipitation (>0.3cm) while ≥10°C |
| npday | Penultimate maximum days without precipitation (≤0.3cm) while ≥10°C |
| npcontdy | Penultimate maximum consecutive days without precipitation (≤0.3cm) while ≥10°C |
| vdday | Penultimate maximum days with VPD>750 Pa while ≥10°C |
| vdcontdy | Penultimate maximum consecutive days with VPD>750 Pa while ≥10°C |
| vwcondty | Penultimate maximum consecutive days with VPD<1000 Pa while ≥10°C |
| vwcont3 | Penultimate maximum consecutive ≥3-day periods with VPD<1000 Pa while ≥10°C |
| vwcont5 | Penultimate maximum consecutive ≥5-day periods with VPD<1000 Pa while ≥10°C |
| vwdy | Penultimate maximum consecutive days with VPD<1000 Pa while ≥10°C |
Each of the 17 national maps resulting from passing these criteria through the 18-year DAYMET data set can be viewed over the web. Low values are black, high values are white, and the gray scale is logarithmic, except for penultimate minimum daily temperature, which is shown with an arithmetic color scale.
A Principal Component Analysis (PCA) was performed to remove correlations among the 17 input variables, and all 17 PCA axes were retained to define an orthogonal PCA-based data space in which MGC formed the cluster groups. The table of factor loadings on each Principal Component axis indicated that Factor 1 loaded positively with degree days, degree days heating, mean daytime temperature, minimum temperature, days without precipitation, days below VPD dryness, and negatively with degree days cooling. Thus, Factor 1 can be characterized as heat and dryness. Factor 2 loads positively with precipitation sum, days with precipitation, days above VPD wetness, continuous days >3 above VPD wetness, and continuous days >5 above VPD wetness. Thus, Factor 2 can be characterized as rainfall and wetness. The VPD wetness and VPD dryness load independently on different axes rather than on the same axis with opposing signs, indicates that they convey different and complementary types of information. Factor 3 loads with continuous days above VPD wetness only, Factor 4 loads with continuous days with precipitation events only, Factor 5 loads with continuous days without precipitation events only, and Factor 6 loads with maximum daily temperature. These variables apparently contain information of a different "kind" from the others. The scree plot falls dramatically with Factors 6 through 17, which explain little additional variability. Nevertheless, all 17 PCA axes were retained in the data space used for clustering.
 |
| Medium Size Map |
| Large Size Map |
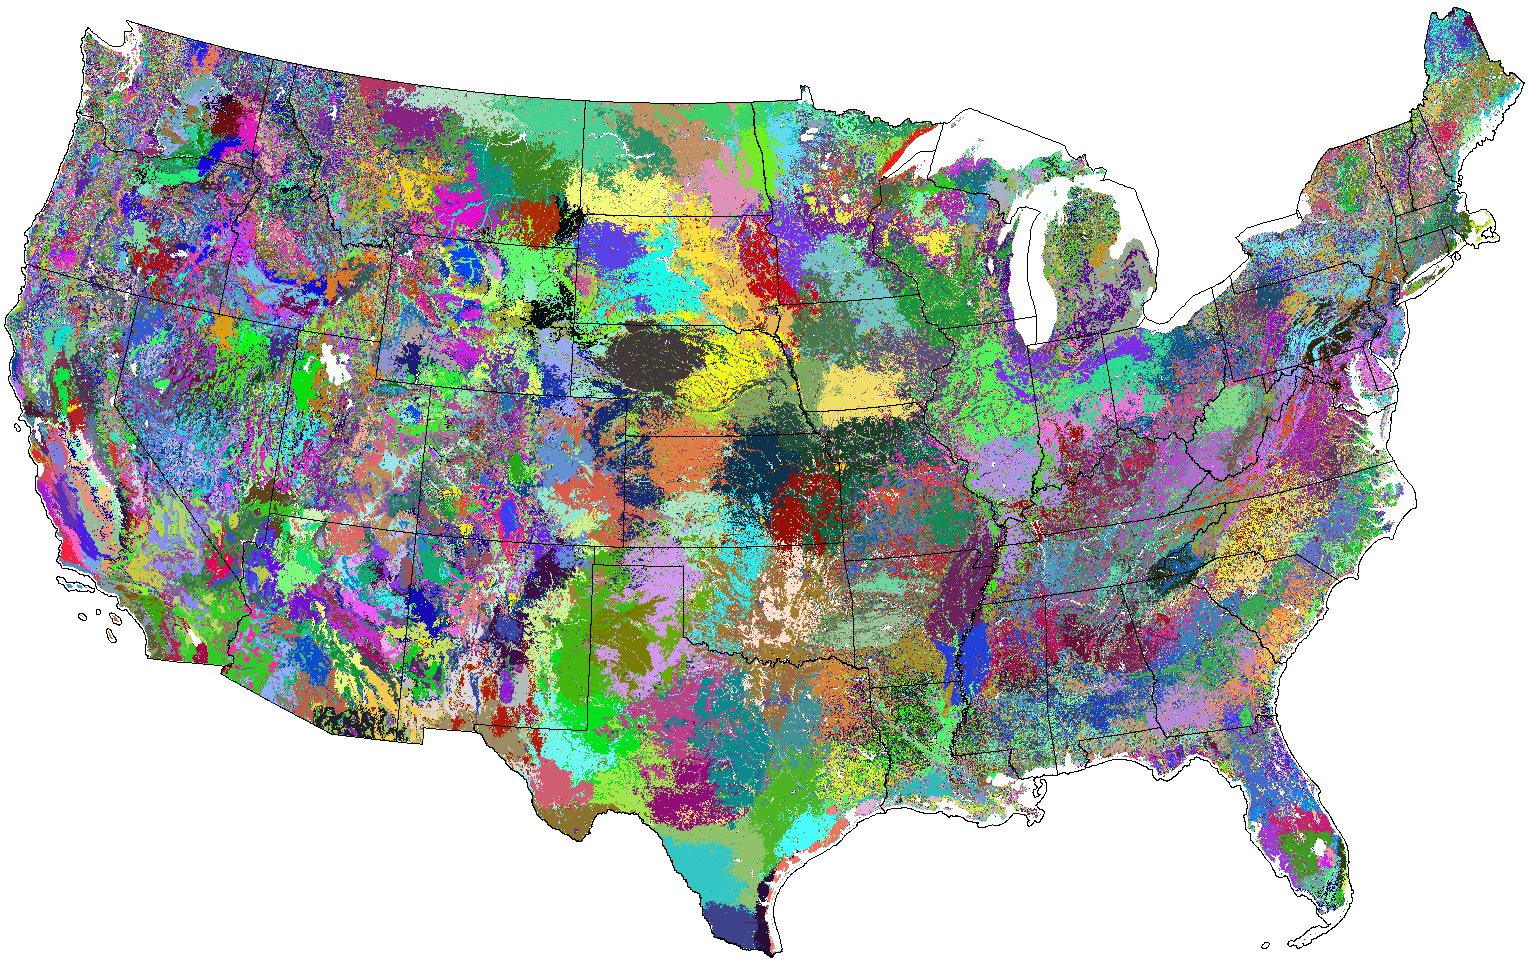
This map shows the 500 most different SOD-only quantitative ecoregions in the lower 48 United States, colored randomly. The SOD ecoregions are mostly spatially contiguous and compact, except in areas where topography and landform are overridingly important. SOD ecoregions tend to be larger in the eastern U.S., and smaller and more divided in the western U.S., due to stronger elevation and climatic gradients.
 |
| Medium Size Map |
| Large Size Map |
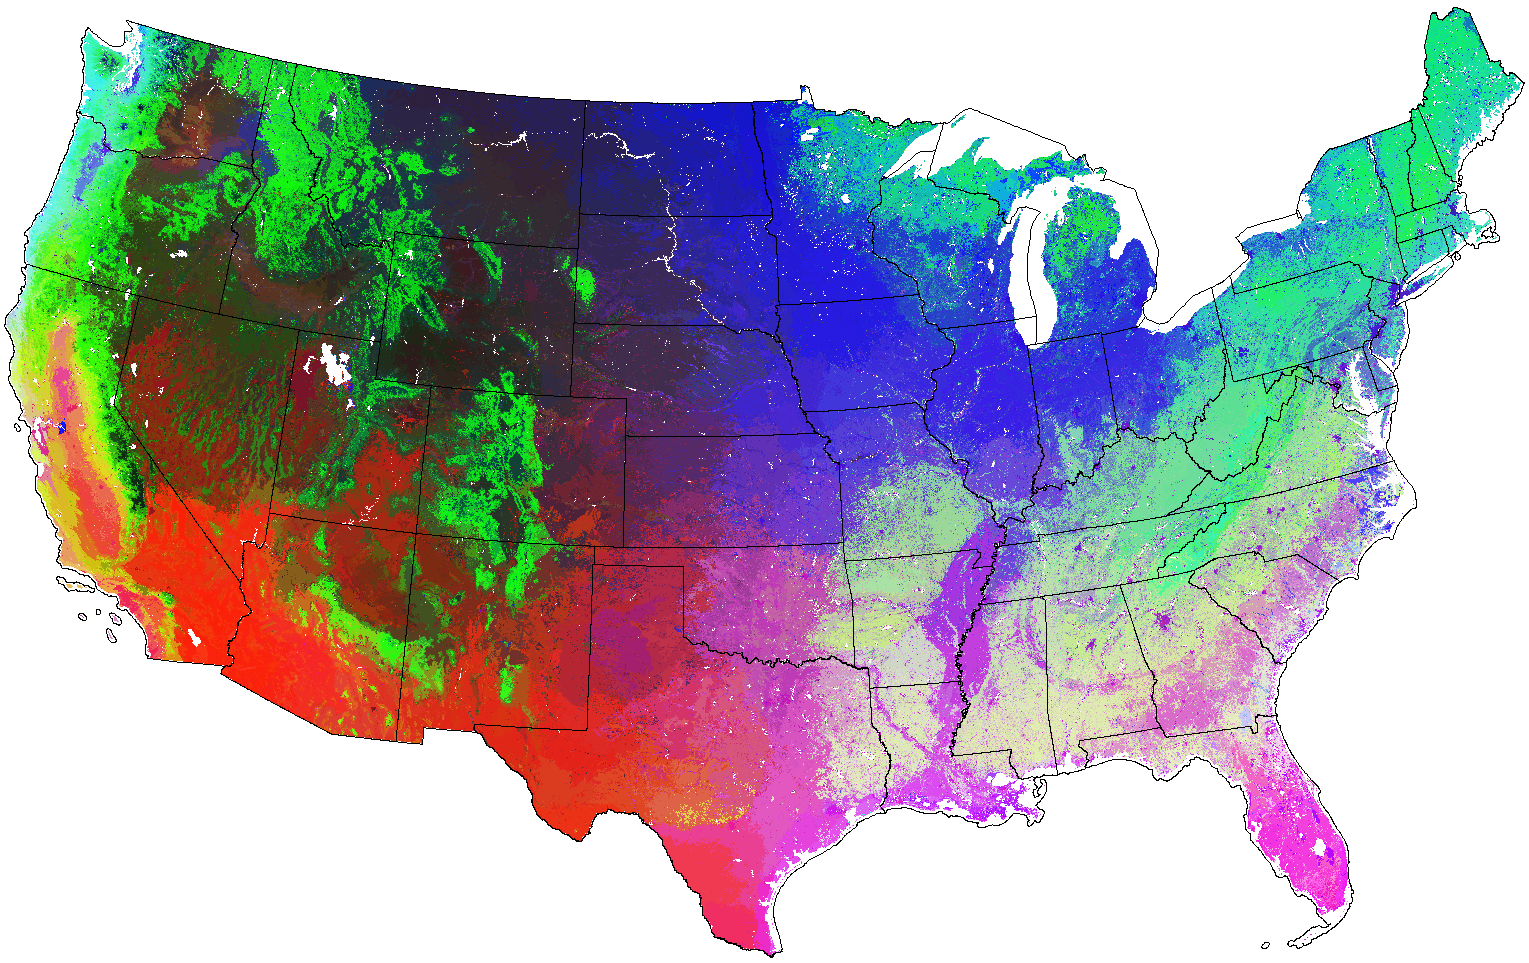
While random colors emphasize the borders between SOD-only ecoregions, we can color them using three PCA axis scores assigned to red, green, and blue to obtain colors for each SOD-relevant ecoregion that reflect something about the relative mixture of the 17 temperature and wetness conditions within each ecoregion. Using these statistically generated Similarity Colors, it is no longer possible to see the borders between individual SOD-ecoregions. However, the shade of colors at any two locations can be compared to gauge the similarity of the combination of SOD-relevant growing conditions present in the two locations. The red component of the Similarity Colors indicates heat and dryness (Factor 1), the green component indicates rainfall and wetness (Factor 2), and the blue component indicates continuous wet periods of less than two days (Factor 3).
Shown in Similarity Colors, many familiar ecoregion features of the conterminous United States can readily be seen in the SOD-only ecoregion map, including the Rocky Mountains and Appalachians, the central valley of California, the Pacific Northwest, and the Sonoran Desert. That all of these regions have been resolved suggests that the SOD-only regionalization is based on ecologically significant parameters, and may produce a meaningful projection of national SOD susceptibility.
 |
| Medium Size Map |
| Large Size Map |
The 1000 most-different SOD-only ecoregions appear similar to the 500-ecoregion set, albeit somewhat more "speckled," especially in the west and northwest. It is unlikely that an accurate map with this many regions could have been produced using human expertise alone.
 |
| Medium Size Map |
| Large Size Map |
When colored using Similarity Colors and viewed at the national scale, the 1000-ecoregion map is nearly indistinguishable from the 500-ecoregion SOD-only map, even though the underlying ecoregion polygons are different. This indicates that the choice of the number of SOD ecoregions to produce using MGC is not critical beyond a certain low level of division for resolving gradients in SOD-relevant growing conditions.
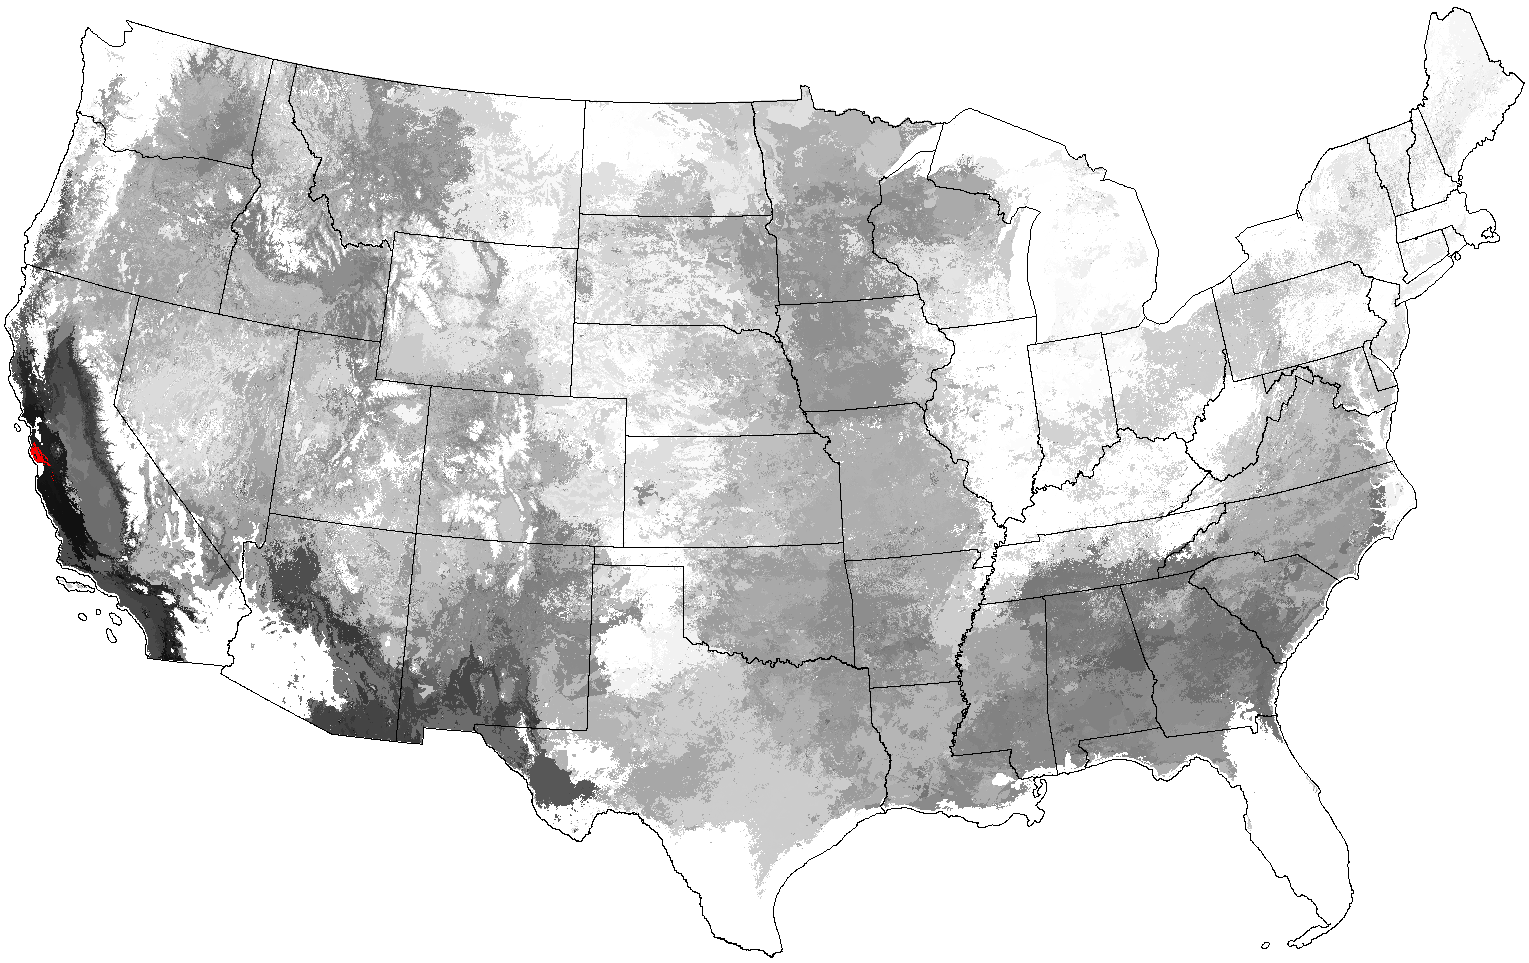
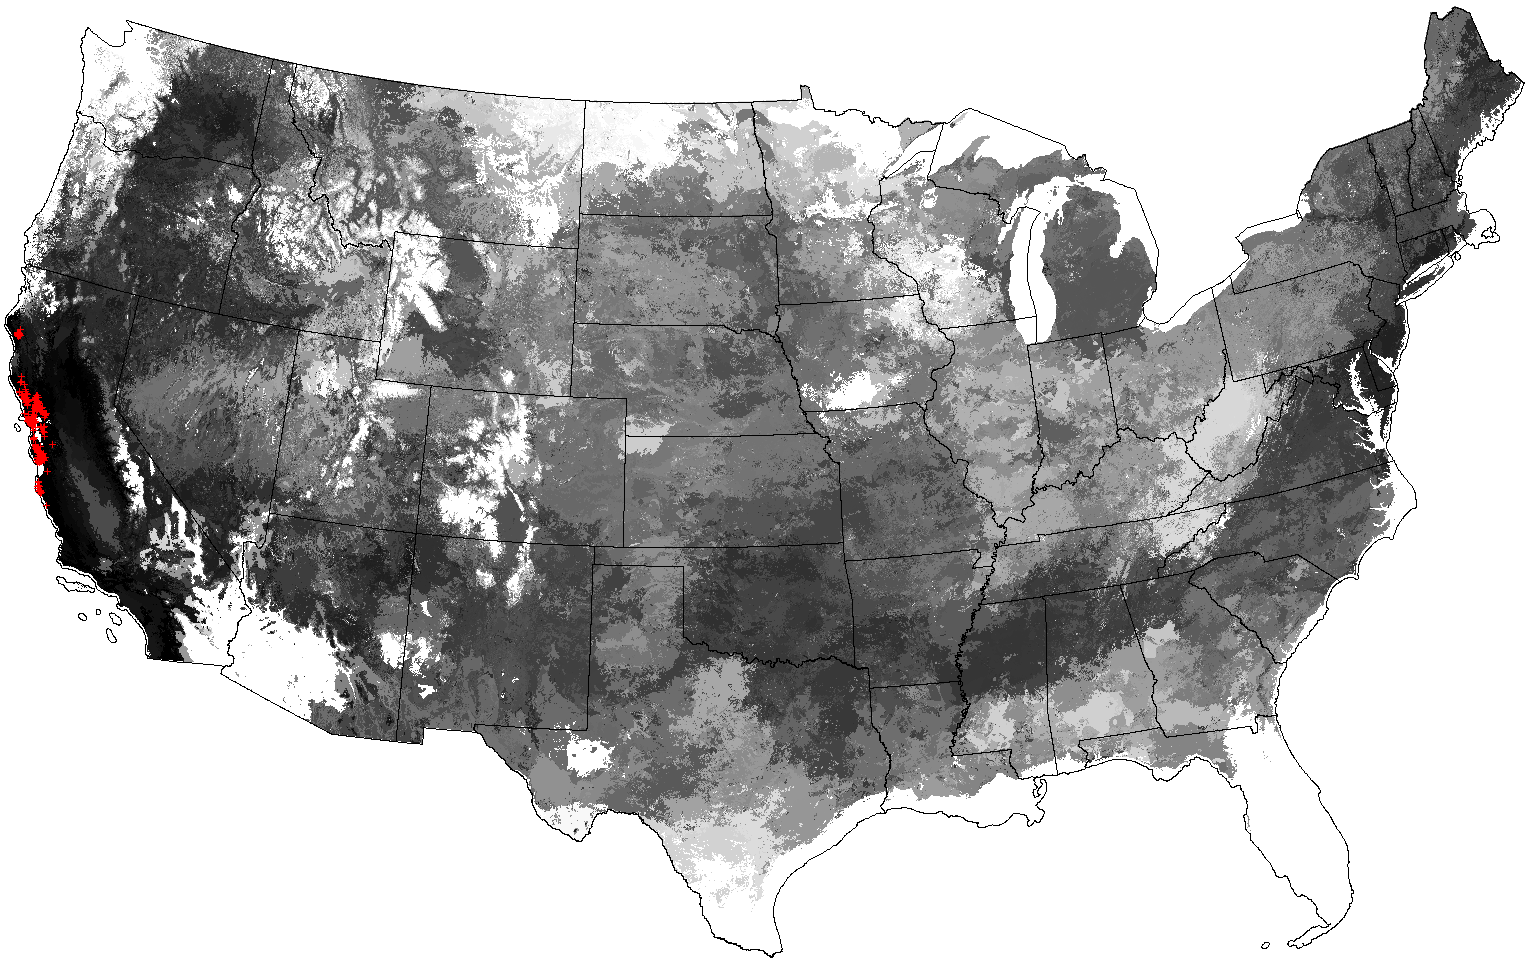
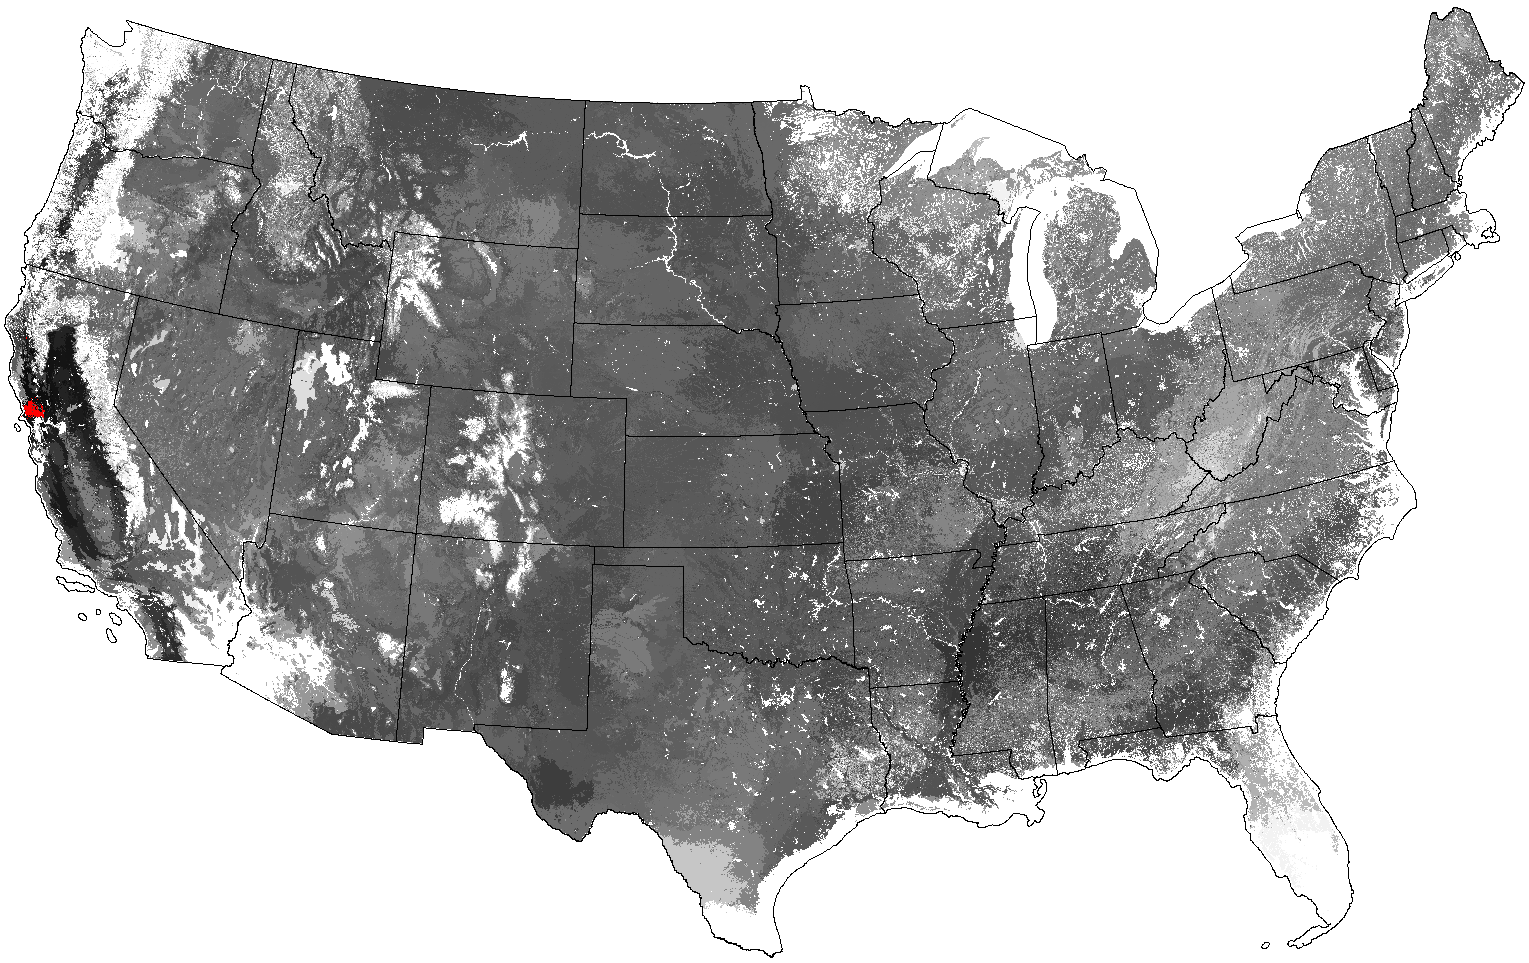
We used the verified outbreak locations collected by the California Oak Mortality Task Force (COMTF) (04/04/2006 version), combined with additional SOD infestation locations found by one of us (Meentemeyer) to find the single SOD-only ecoregions in the 500- and 1000-ecoregion sets corresponding to the worst outbreak areas. The Euclidean distance between these selected SOD ecoregions and all other SOD ecoregions was calculated, and mapped as a gray scale. Blacker areas have greater multivariate similarity in growing conditions to those conditions within the selected outbreak area.
|
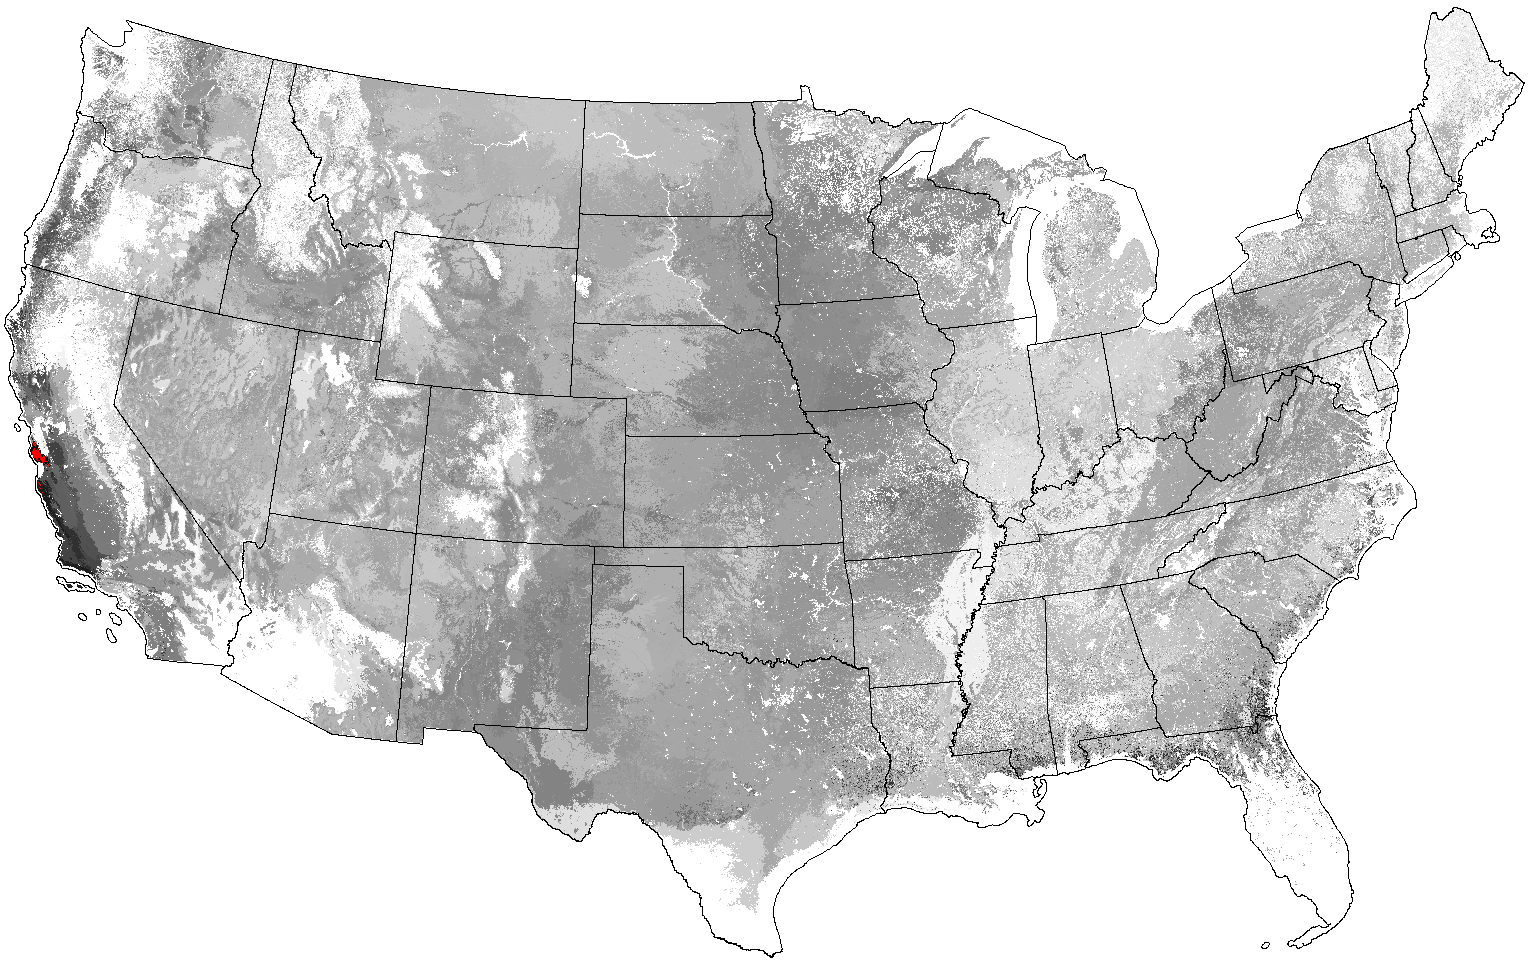
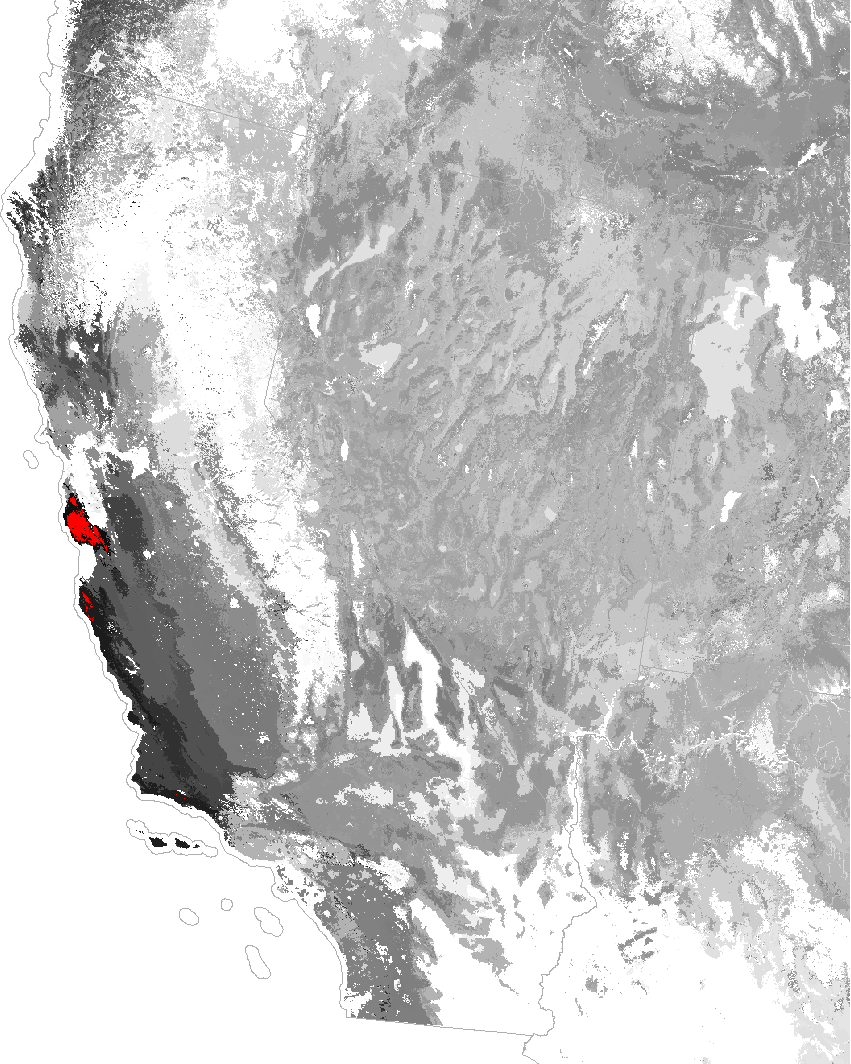
|
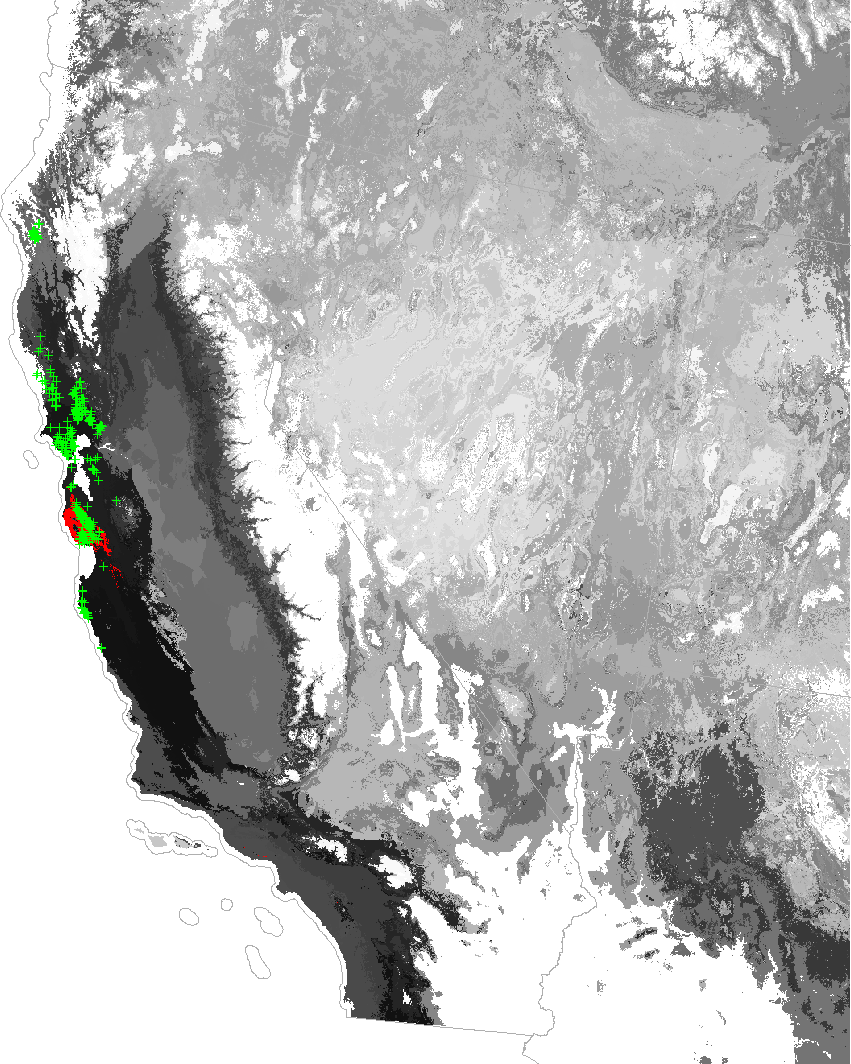
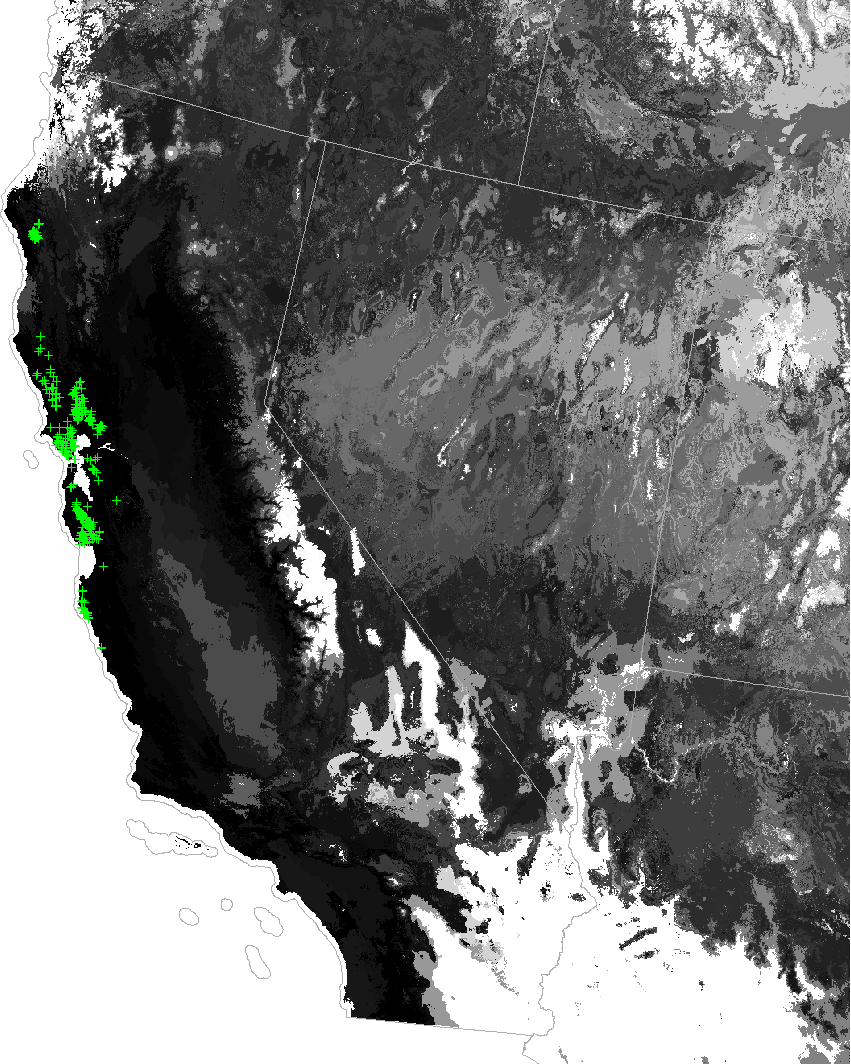
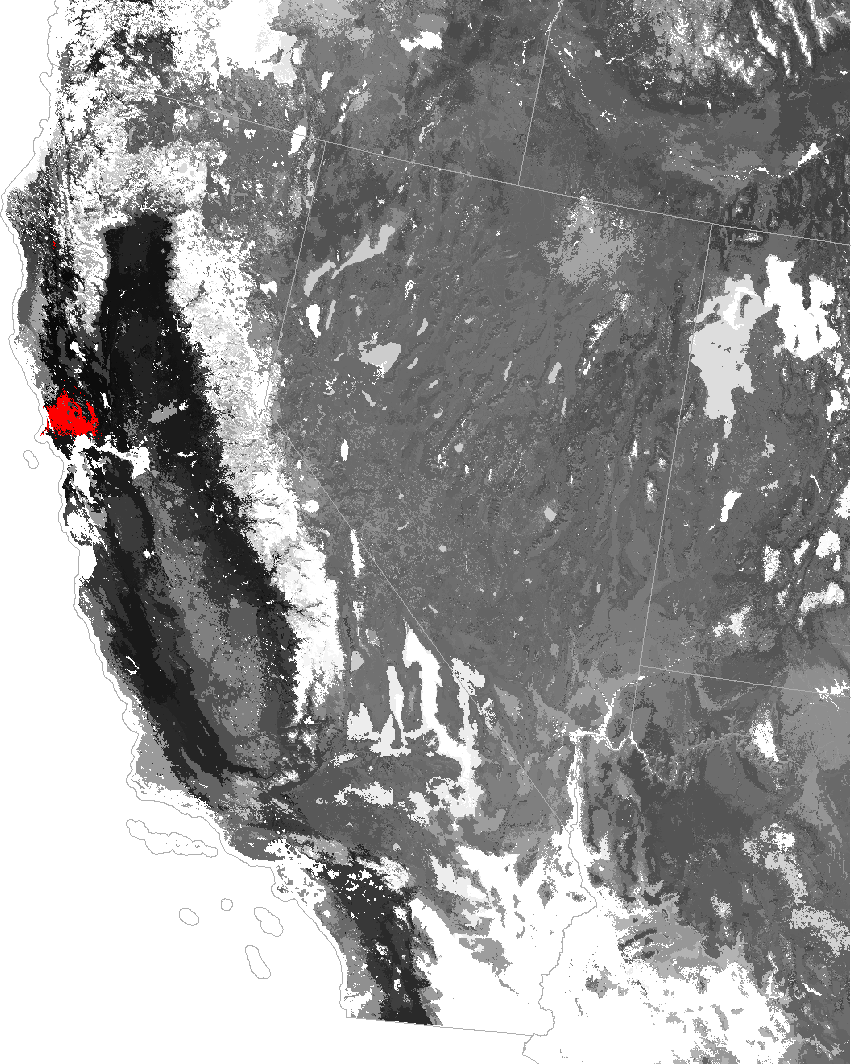
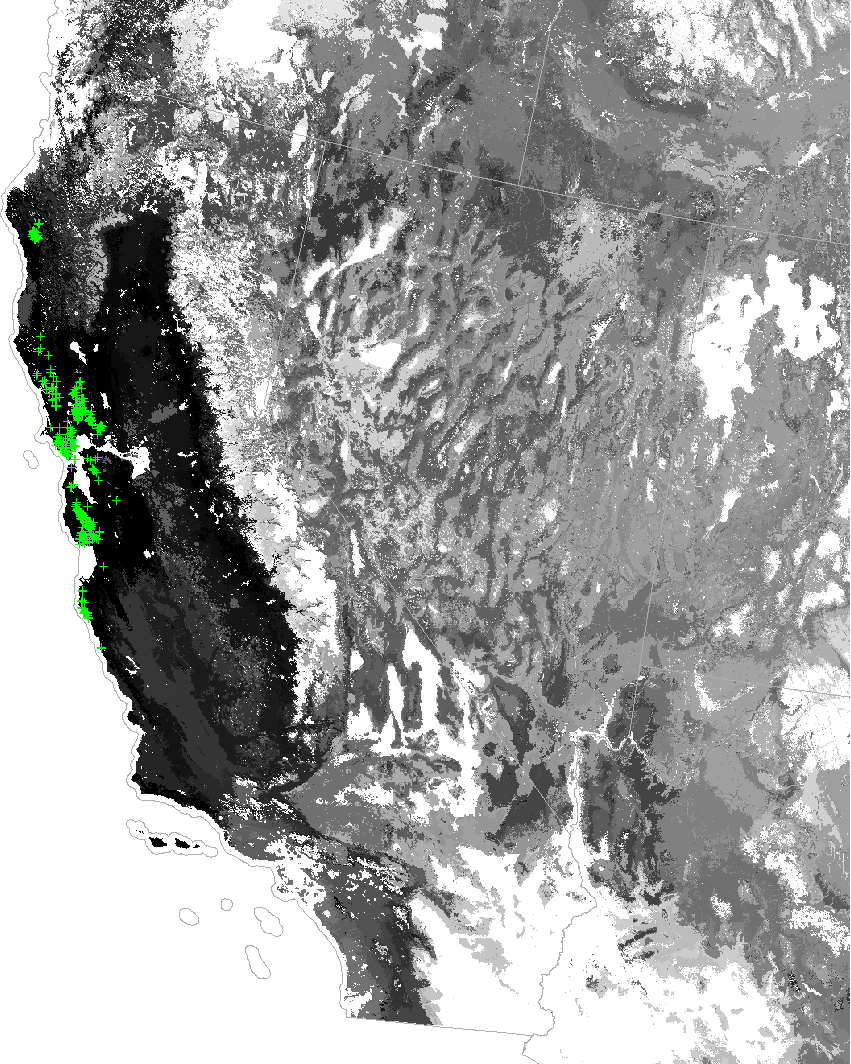
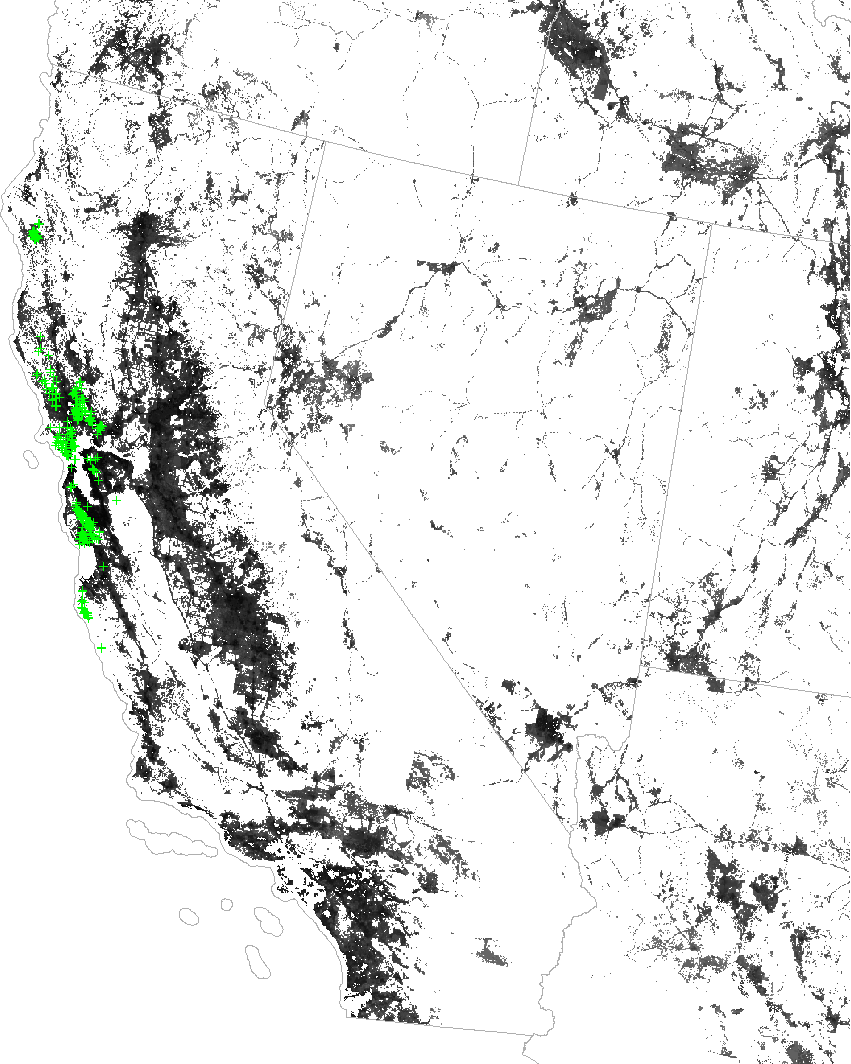
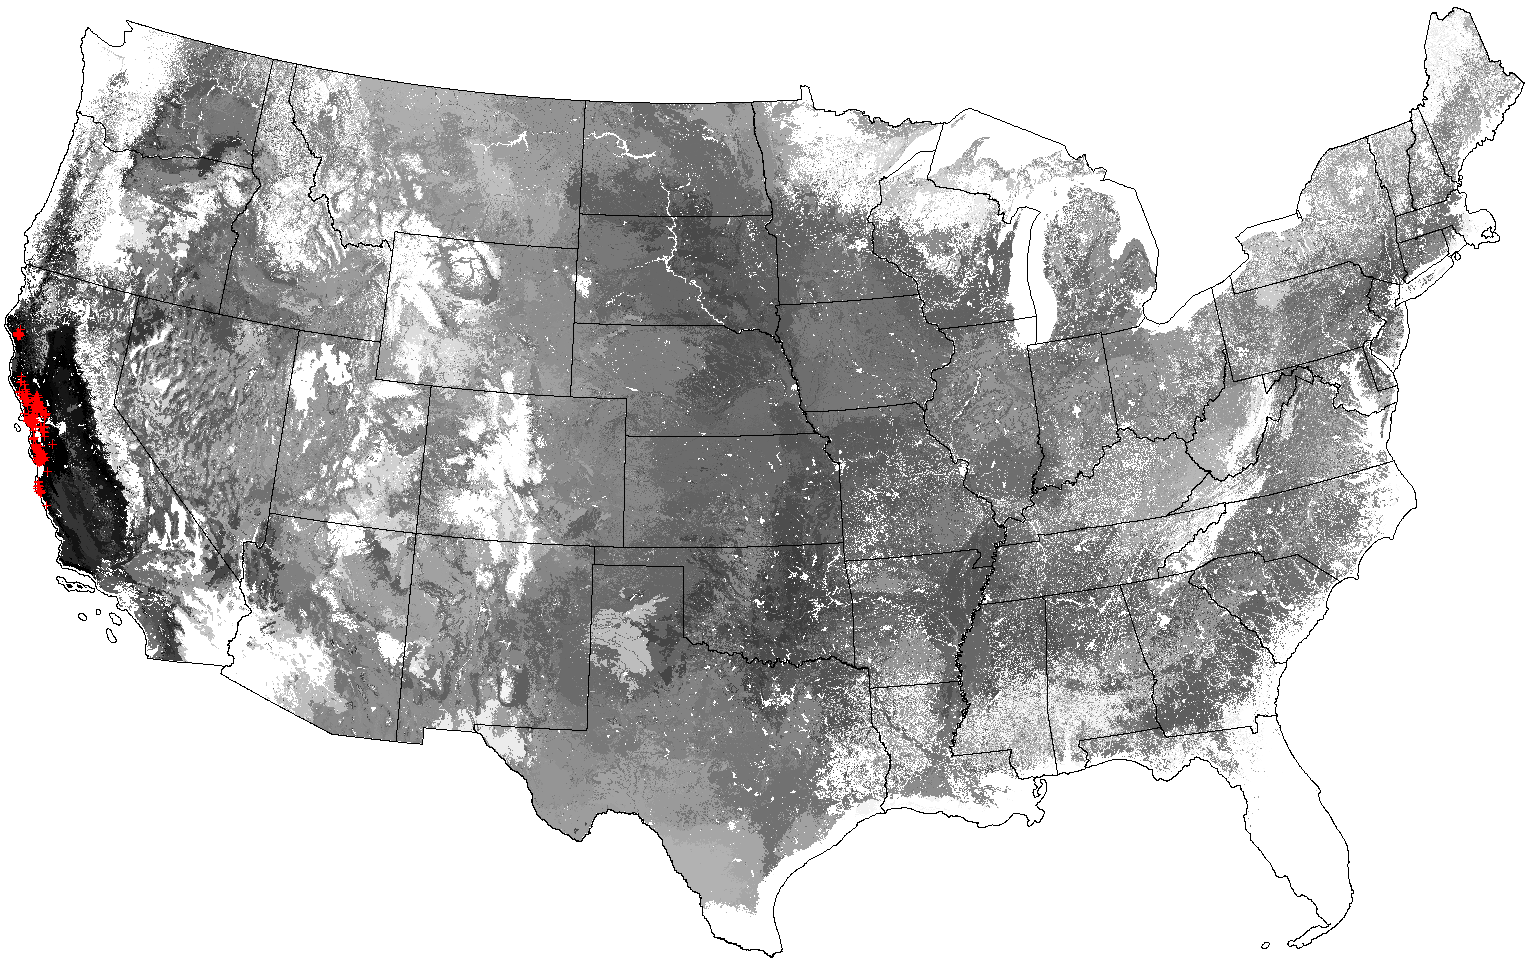
The maps above show the multivariate similarity to environmental conditions in Marin County, CA, or "Marin County-ness" as a predictor of national SOD susceptibility, based on the 500 SOD-only ecoregions. The map on the right zooms in to show the active SOD outbreak areas. The SOD ecoregion selected as the training site (and providing the origin for the similarity distance calculations) is colored in red. The augmented verified SOD outbreak locations are shown in green for reference, but were not used in the calculations.
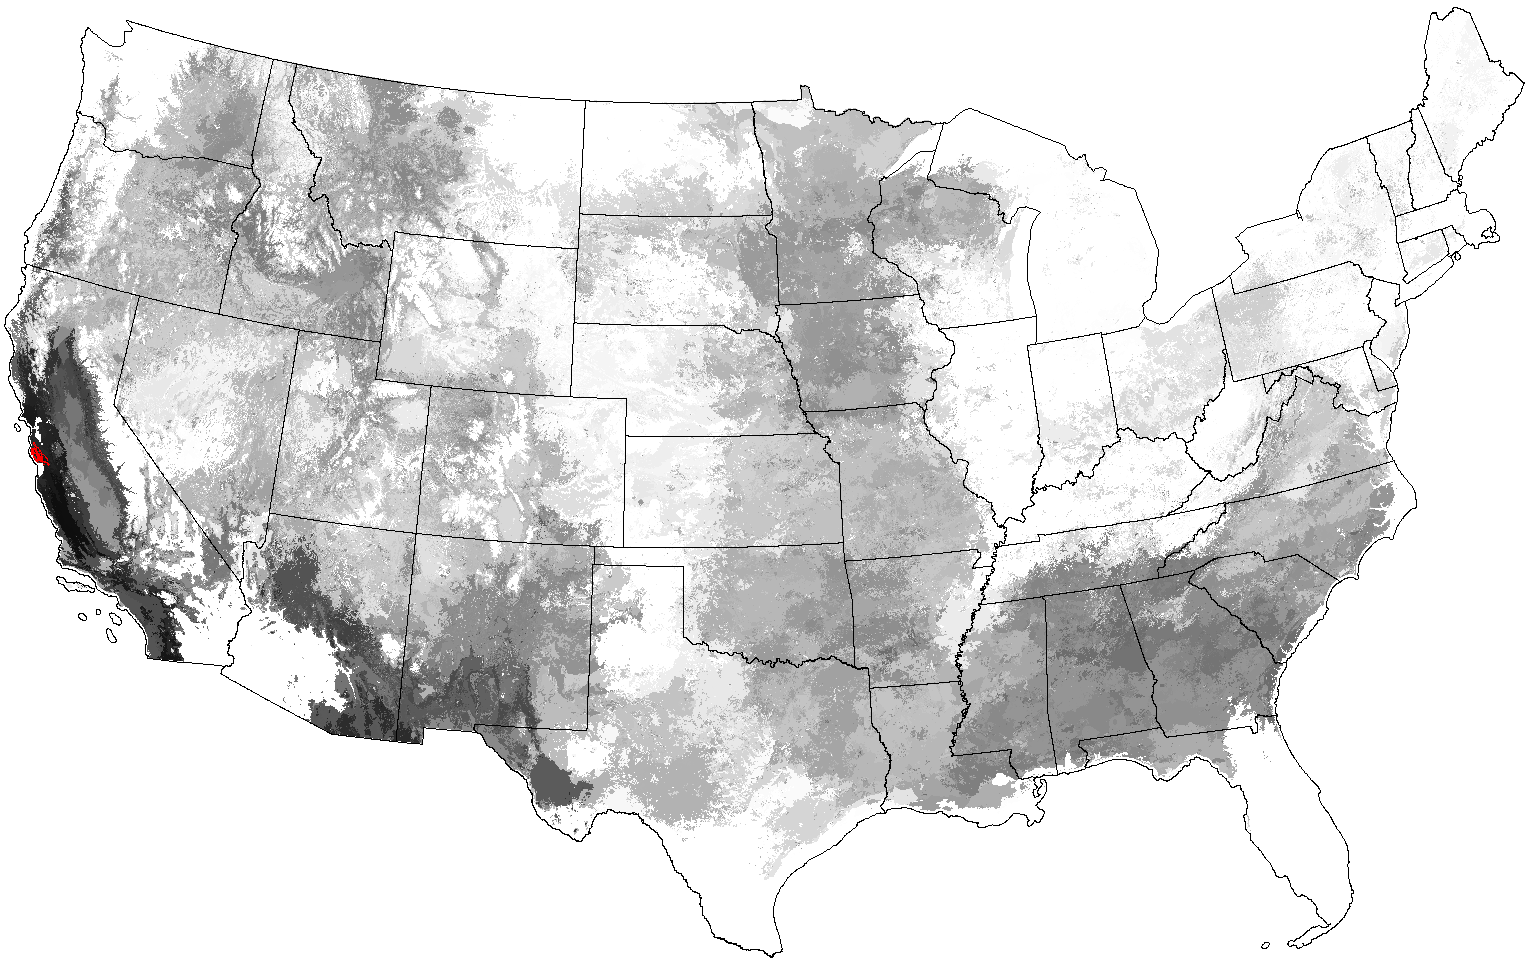
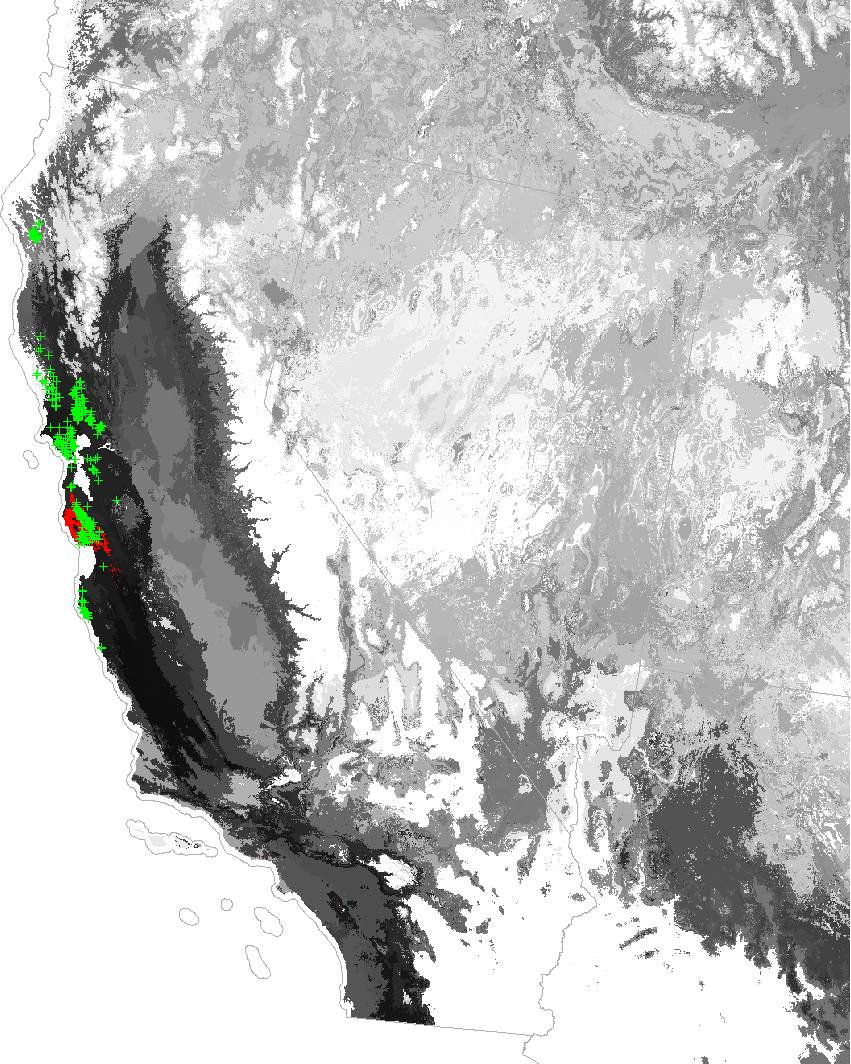
The pair of maps below show the same "Marin County-ness," but similarities in environmental conditions were calculated based on the 1000 SOD-relevant ecoregions map.
|
|
Both sets of "Marin County-ness" maps are similar in appearance, and indicate that much of the conterminous United States has some degree of similarity to the SOD-only growing conditions found in Marin County, CA. Both versions of the map indicate a high degree of similarity with Marin County growing conditions in all verified SOD outbreak locations. After the west coast, the southeast shows the next highest degree of similarity, in terms of P. ramorum growing conditions. Clearly some areas are included as having similar SOD growth conditions, but which are not thought to have suitable hosts for the pathogen.
|
|
The above pair of maps indicate multivariate similarity to environmental conditions in Santa Cruz, CA, or "Santa Cruz-ness" as a predictor of national SOD susceptibility, based on the 500 SOD-only ecoregion map.
The pair of maps below show the same "Santa Cruz-ness," but were calculated based on the 1000 SOD-relevant ecoregions map.
|
|
The national pattern of SOD susceptibility predicted with the 500- and 1000-eocregion maps show similar patterns, although the 1000-ecoregion map has finer spatial resolution.
The pair of maps below show a network analysis calculated based on the 1000 SOD-only ecoregions map. Multivariate similarity was calculated between the 17 environmental conditions within each of the 1000 SOD-ecoregions and the most-similar SOD-ecoregion containing a SOD outbreak location, and then mapped as a gray scale.
|
|
While the west coast is predicted as the most susceptible, there are parts of eastern Washington and Oregon, and a few areas along the northern Atlantic coast whose growing conditions are nearly as good for P. ramorum. There is a band of susceptibility across the southern United States from northern Arizona, through New Mexico, Oklahoma, and through northern Mississippi, northern Alabama and north Georgia. Little susceptibility is shown in the northern central U.S., in the Rockies, and in the Sonoran desert.
Because it is based on environmental conditions required by the pathogen only, this analysis probably predicts susceptibility to SOD in locations where there are no suitable P. ramorum hosts. True susceptibility requires the presence of a suitable host as well as conditions suitable for the pathogen. The MGC analysis needs to be repeated, adding environmental conditions necessary to permit growth of suitable foliar hosts.
As a second step in the prediction of national susceptibility, we included environmental conditions likely to control the geographic range of potential hosts for SOD beyond its current west coast distribution. An additional 20 environmental characteristics were added to the list of 17 characteristics believed to potentially limit the spread of P. ramorum itself, as shown in the Table 2 below. National maps of these 37 environmental characteristics at 1 km2 resolution formed the basis of the second set of national SOD susceptibility predictions.
| Variable | Climatic Criterion Regulating Phytophthora ramorum or Potential Host Growth |
|---|---|
| dday | Mean degrees × days heating >0°C |
| ddayh | Penultimate maximum degrees × days heating >18°C |
| ddayc | Penultimate maximum degrees × days cooling <18°C |
| tday | Mean daytime (daylight) temperature |
| tmax | Penultimate maximum highest daily temperature |
| tmin | Penultimate minimum lowest daily temperature |
| psum | Penultimate maximum precipitation sum while ≥10°C |
| pday | Penultimate maximum days with precipitation (>0.3cm) while ≥10°C |
| pcontday | Penultimate maximum consecutive days with precipitation (>0.3cm) while ≥10°C |
| npday | Penultimate maximum days without precipitation (≤0.3cm) while ≥10°C |
| npcontdy | Penultimate maximum consecutive days without precipitation (≤0.3cm) while ≥10°C |
| vdday | Penultimate maximum days with VPD>750 Pa while ≥10°C |
| vdcontdy | Penultimate maximum consecutive days with VPD>750 Pa while ≥10°C |
| vwcondty | Penultimate maximum consecutive days with VPD<1000 Pa while ≥10°C |
| vwcont3 | Penultimate maximum consecutive ≥3-day periods with VPD<1000 Pa while ≥10°C |
| vwcont5 | Penultimate maximum consecutive ≥5-day periods with VPD<1000 Pa while ≥10°C |
| vwdy | Penultimate maximum consecutive days with VPD<1000 Pa while ≥10°C |
| mdepth | Depth of mineral soil |
| waterdepth | Depth to water table |
| nitrogen | Soil Kjeldahl nitrogen to 50 cm depth |
| om | Soil organic matter to 50 cm depth |
| awc | Soil plant-available water holding capacity to 1.5m |
| cti | Compound Topographic Index (CTI) |
| solargs | Total solar insolation during the local growing season, including clouds, aerosols, slope and aspect physiography |
| solarngs | Total solar insolation during the local non-growing season, including clouds, aerosols, slope and aspect physiography |
| EVIgs | Enhanced Vegetation Index (EVI) integrated over the local growing season |
| EVIngs | Enhanced Vegetation Index (EVI) integrated over the local non-growing season |
| FPARgs | Fraction of Photosynthetically Active Radiation (FPAR) absorbed by vegetation integrated over the local growing season |
| FPARngs | Fraction of Photosynthetically Active Radiation (FPAR) absorbed by vegetation integrated over the local non-growing season |
| LAIgs | Leaf Area Index (LAI) integrated over the local growing season |
| LAIngs | Leaf Area Index (LAI) integrated over the local non-growing season |
| pcttree | Percent tree cover |
| pctbare | Percent bare cover |
| GPPgr | Gross Primary Production (GPP) integrated over the local growing season |
| GPPngs | Gross Primary Production (GPP) integrated over the local non-growing season |
| RIgr | Respiration Index (RI) integrated over the local growing season |
| RIngs | Respiration Index (RI) integrated over the local non-growing season |
These factors loaded onto the 37 Principal Component axes as follows: PCA1 loaded with variables related to heat, dryness, and solar radiation; PCA2 pertained to precipitation, wetness, and growing season vegetation characteristics; PCA3 was related to non-growing season vegetation characteristics. PCAs beyond 3 were dominated by single variables of continuous days of wetness, soil organic matter, plant-available water, and compound topographic index (PCI7).
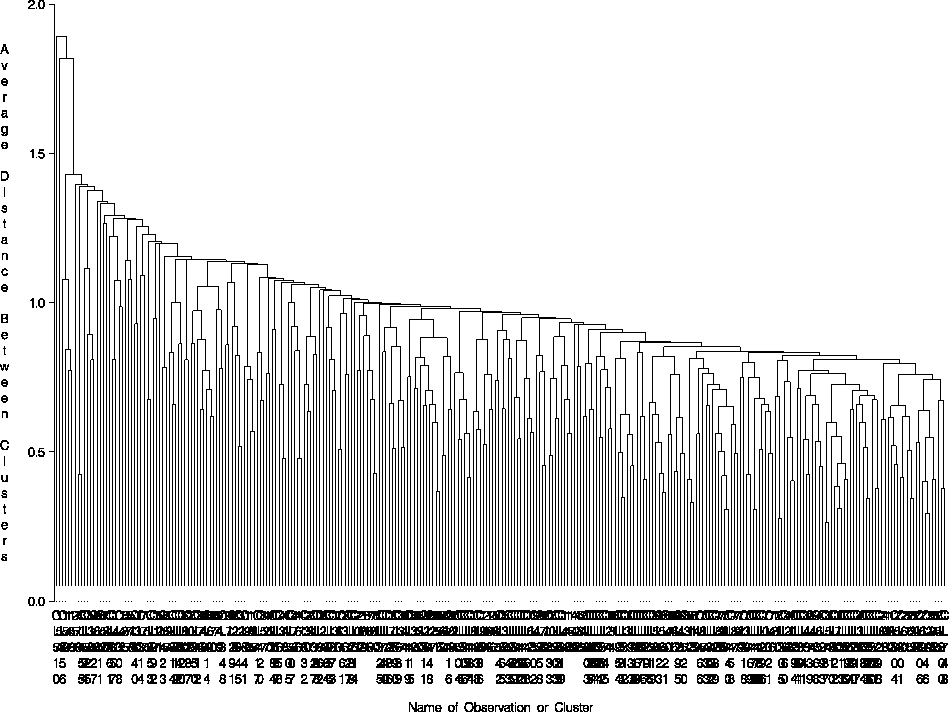
How similar are the SOD-relevant environmental conditions at the current confirmed SOD outbreak locations? We sorted the 961 COMTF SOD outbreak locations by longitude and latitude, assigning accession numbers that increase west-to-east and north-to-south (i.e., reading style), and performed full hierarchical agglomerative clustering on the 17 SOD-only and the 37 SOD-plus-Host environmental characteristics at those locations. This analysis only considers the combinations of conditions at current outbreak locations, irrespective of the full set of conditions elsewhere in the lower 48 United States, and does not make use of any SOD ecoregions.
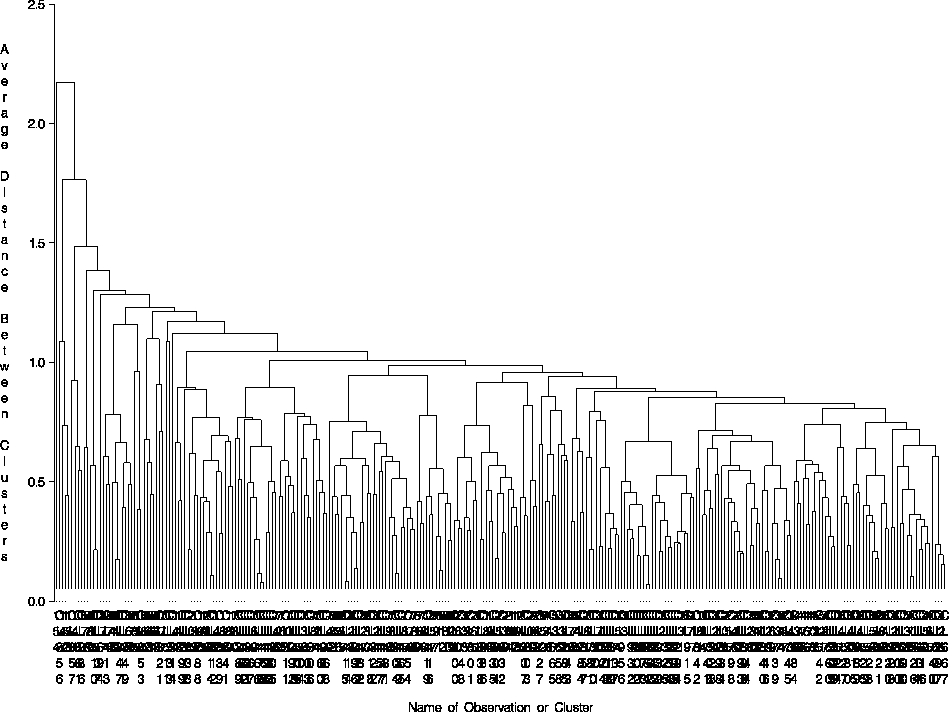
A Similarity tree is used to depict the degree of multivariate similarity in the combination of SOD growing conditions, and to show groups of outbreak locations with similar mixtures of conditions. The agglomerative clustering process begins with each SOD outbreak location as a separate "leaf" in the tree. At each successive step, the two most-similar locations are combined into a single group. Such joinings are represented by combining the two leaves into a single common branch to produce a binary tree. The agglomeration continues until all SOD outbreak locations have been joined into a single common group.
The Similarity trees that are produced show each SOD location across the bottom, and decreasing similarity at the left. The agglomerative joining proceeds upwards from the bottom of the diagram. Taller features represent groups that are more different, and joined later in the agglomerative process. The root of the tree, indicating the single final, all-encompassing group is shown by the tallest feature. The Similarity trees are sorted so that the most different SOD locations (i.e., joining last) are on the left and the most similar (i.e., joining first) are on the right, and similar SOD locations (i.e., members of the same groups) are adjacent, if possible without violating the topology of the tree.
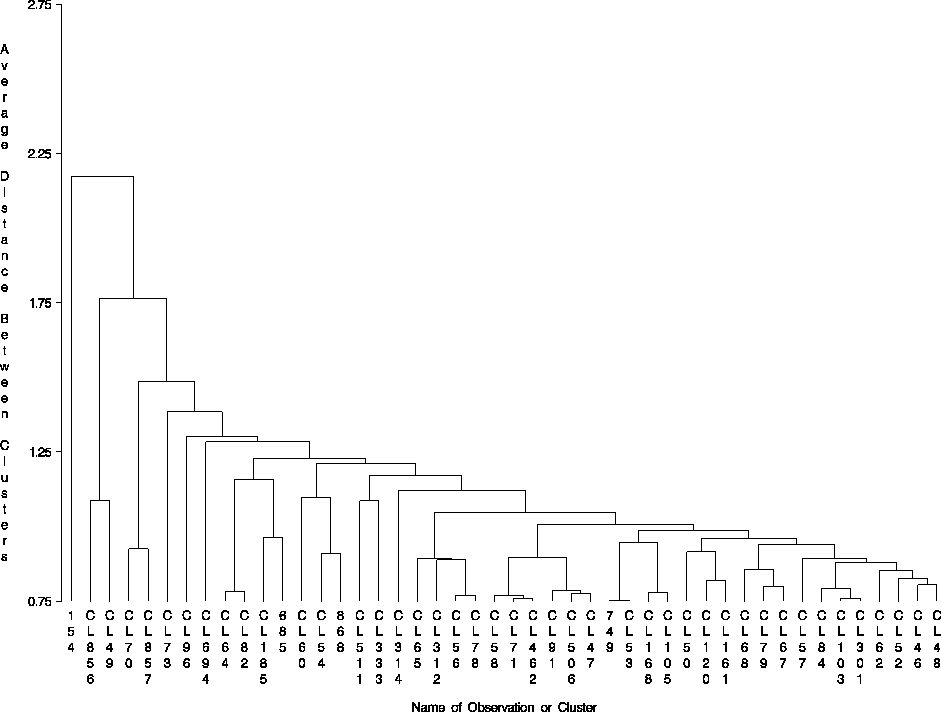
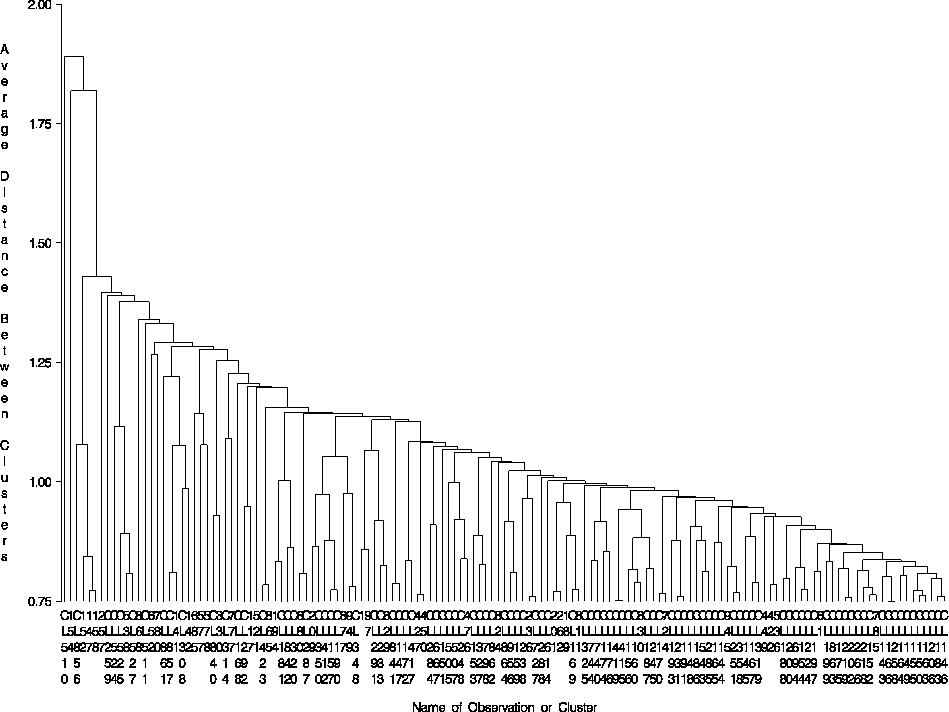
Similarity for SOD-only and SOD-plus-Host growing conditions are each presented as two Similarity trees. The first Similarity tree for each shows the entire tree, except that SOD outbreak locations joined in the earliest agglomerative steps have been pruned away for clarity. Nevertheless, these trees are so complex that the outbreak accession labels are illegible. A second Similarity tree is presented which is pruned to a difference level of 0.75, so that the accession numbers of each leaf can be seen. Leaves on the Similarity trees are labeled either with the accession number of the SOD outbreak location, or with a "CL" followed by the number of the earliest parent SOD outbreak location for a multiple-location cluster.
|
|
||||||
| Figures 3a and 3b. Similarity among outbreak areas based on SOD-only growing conditions. | |||||||
|
|
||||||
| Figures 4a and 4b. Similarity among outbreak areas based on SOD-plus-Host growing conditions | |||||||
With few exceptions, most SOD outbreak locations are fairly similar with regard to the combinations of SOD-only and SOD-plus-Host growing conditions. The leftmost graphs, particularly for SOD-only conditions, indicate associations of outbreak locations into similar "super-groups" appearing around 0.8 on the similarity axis. Differences are small, however, among most of these super-groups, as indicated by the relatively low slope of the upper profile of the trees in the righthand graphs. Only a few super-groups show differences in environmental conditions, shown by the narrow peak at the left side of each tree. Outbreak location 154, in the Sonoma County Redwoods area, is one of the most distinct sites in each case. The lower SOD-plus-Host trees show a slightly steeper slope, since there are more ways to be different when 37 conditions are considered than when including only a subset of 17 conditions.
In neither of the two cases are the geographically ordered accession numbers of the locations associated with nearby numbered locations in similarity groups. Accession numbers are not close to one another within groups as one proceeds along the horizontal axis. That the similarity groups are not formed of geographically nearby outbreak locations is further evidence of a relative uniformity of conditions within the known SOD outbreak locations.
All of the known outbreak locations occur within a fairly small geographic area. The coastal proximity and maritime influence probably serves to further homogenize the environmental conditions at these locations.
The general similarity of both SOD-only and SOD-plus-Host conditions across known outbreak locations might indicate that P. ramorum can tolerate only a relatively narrow environmental envelope, and that the pathogen has already infested many of the areas that are accessible to it. If this is the case, we are well-justified in using the current SOD outbreak locations to predict national susceptibility to SOD.
|
| Medium Size Map |
| Large Size Map |
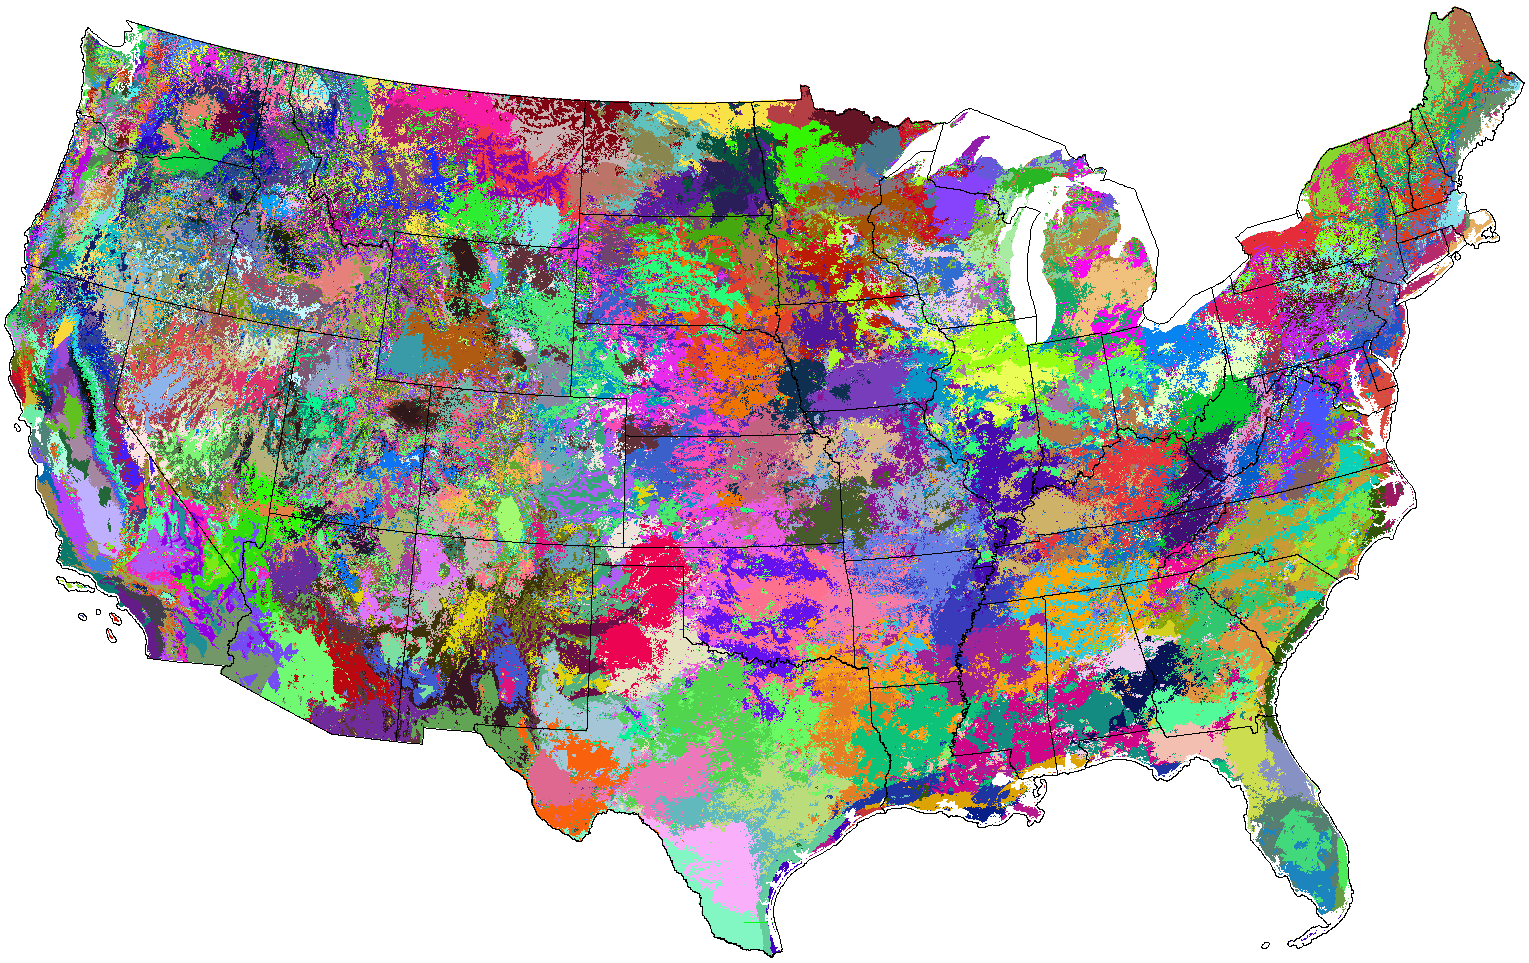
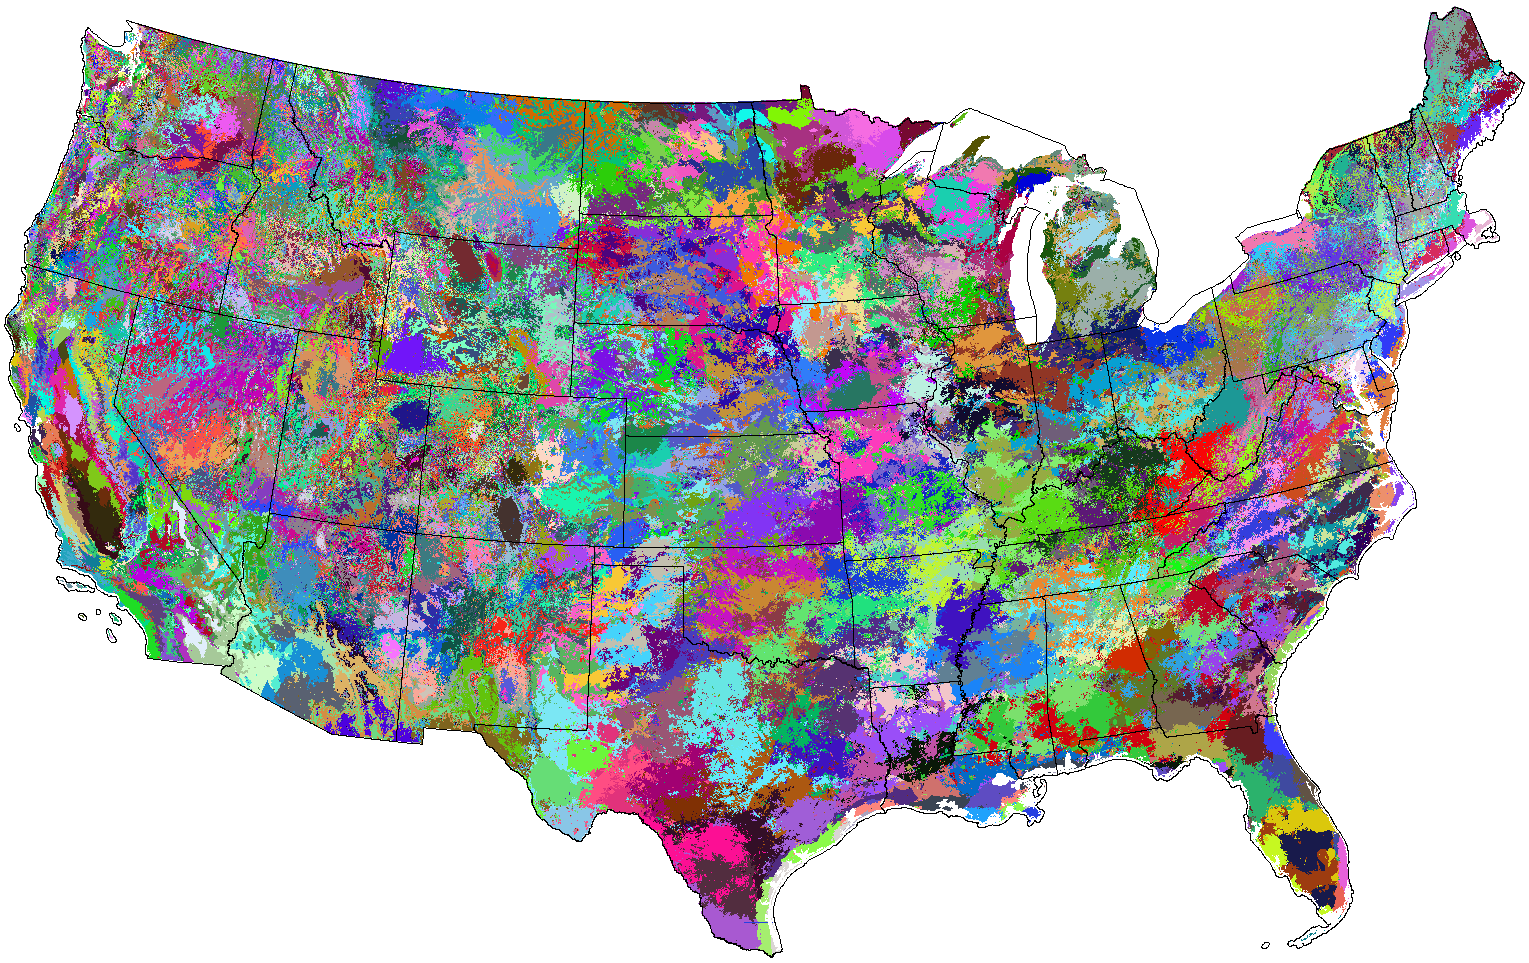
We used MGC within the 37-character orthogonal PCA data space to create the 1500 most-different SOD-plus-Host ecoregions within the lower 48 United States, shown here in random colors.
 |
| Medium Size Map |
| Large Size Map |
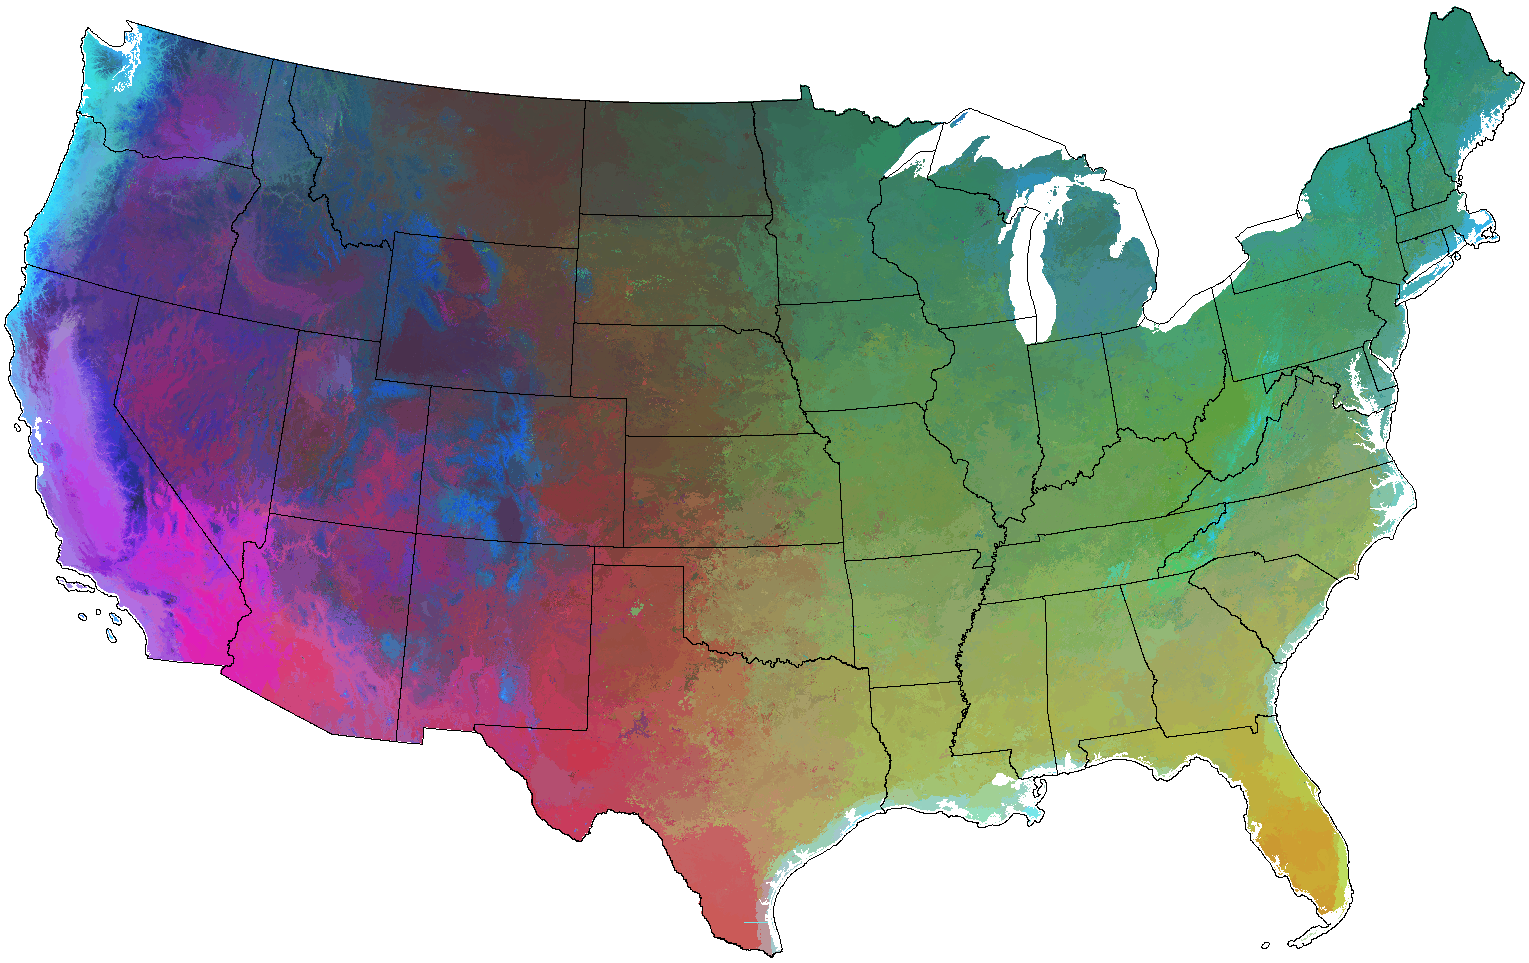
Colored using Similarity Colors and viewed at the national scale, this map of 1500 SOD-plus-Host ecoregions reveals many complex national gradients. The loadings of each variable onto each of the PCA factor colors are interpretable as follows: heat, dryness, and solar radiation load on the red component; ecosystem productivity, LAI, percent tree cover, and EVI and FPAR in the non-growing season are shown as the green component; and precipitation, wetness, and EVI and FPAR in the growing season are indicated as the blue component. Thus, the southern and western United States are predominantly red from heat and solar radiation, and the Pacific Northwest is light blue, having large values of all three components dominated by precipitation and vegetation. The eastern United States is predominantly green because of high ecosystem productivity, LAI, and tree cover.
|
|
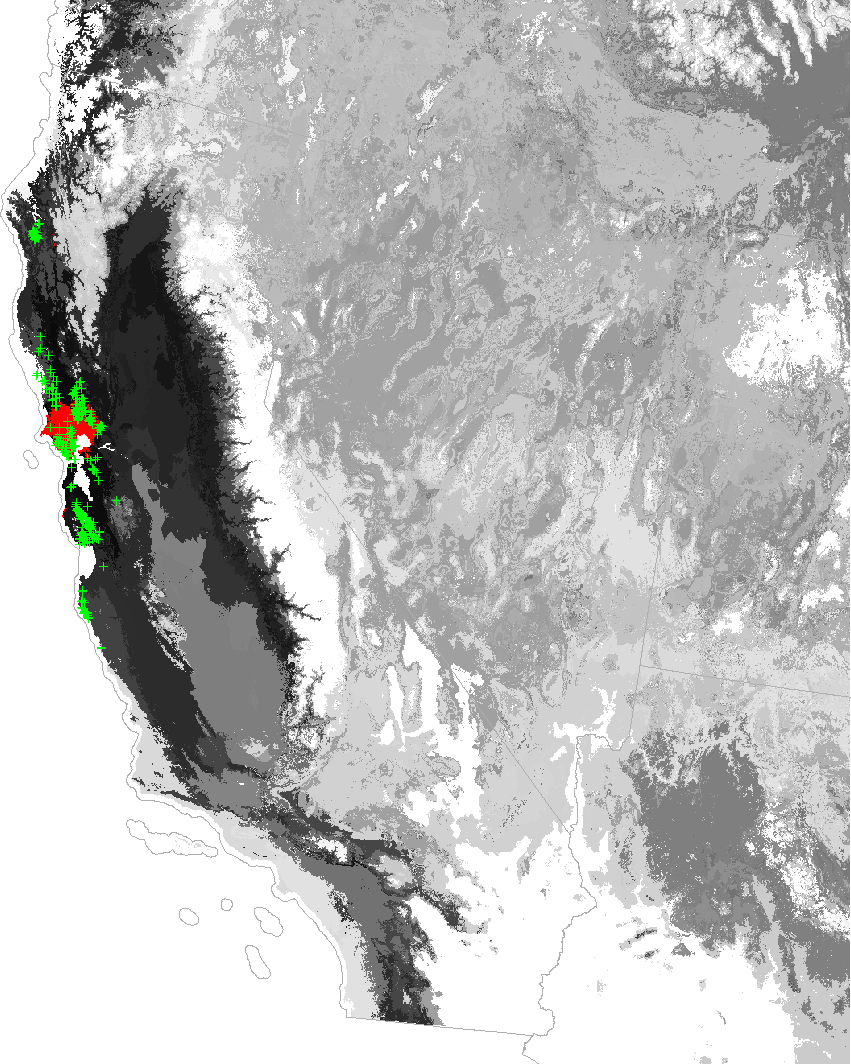
Multivariate similarity to Marin County, CA, including environmental conditions likely to limit growth of potential hosts, according to the 1500 most-different SOD-plus-Host quantitative ecoregions, as a predictor of national SOD susceptibility.
Marin zoom
|
|
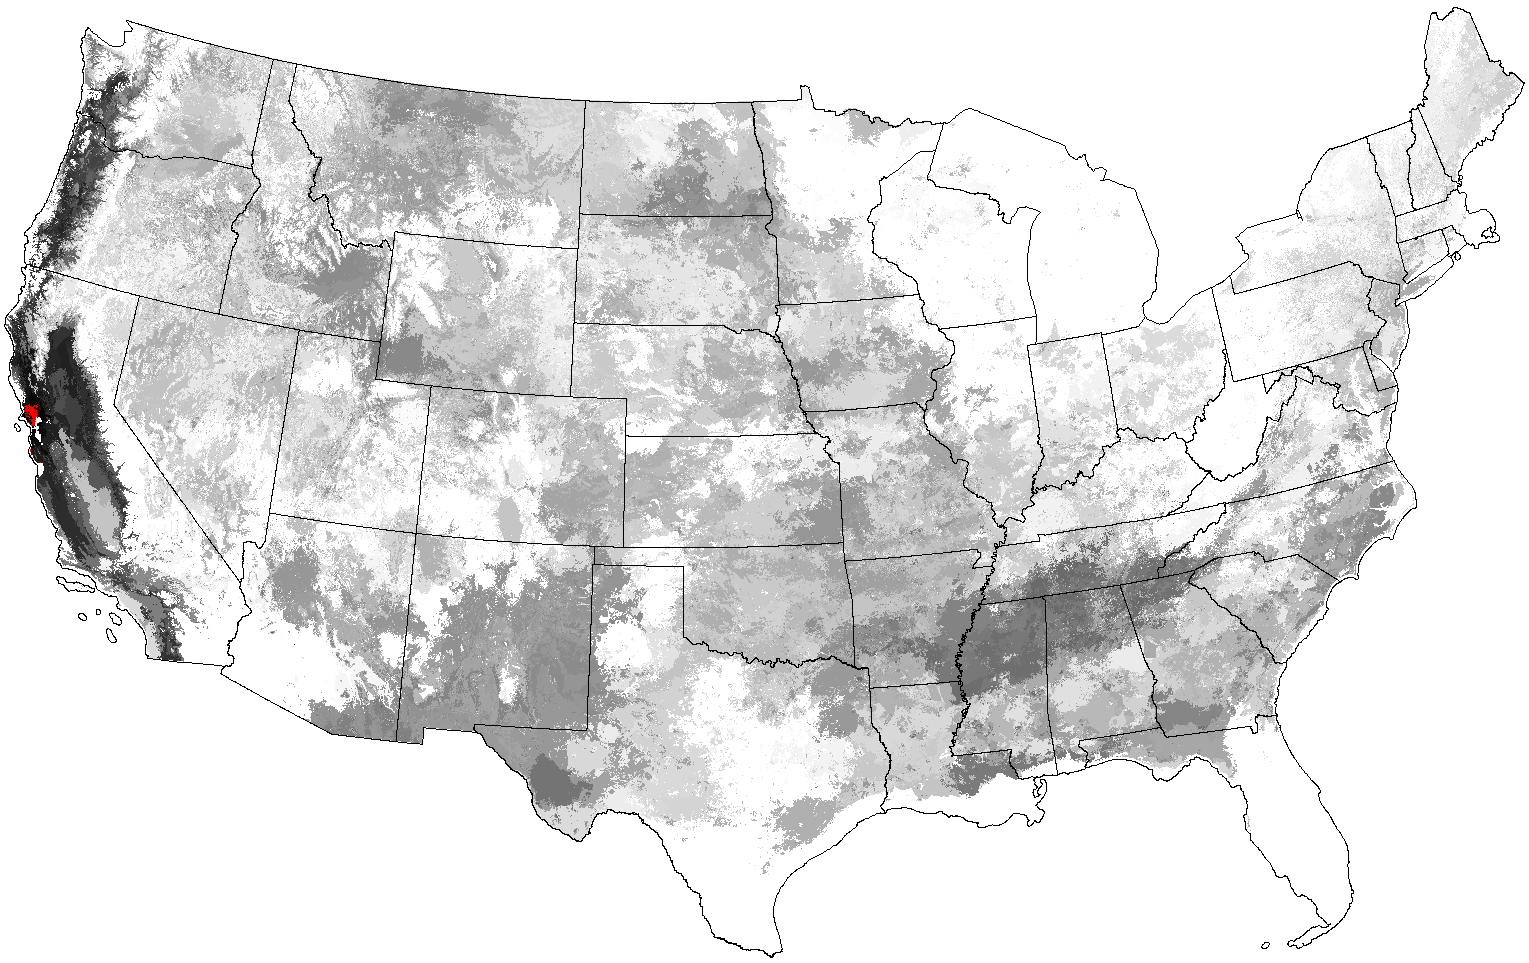
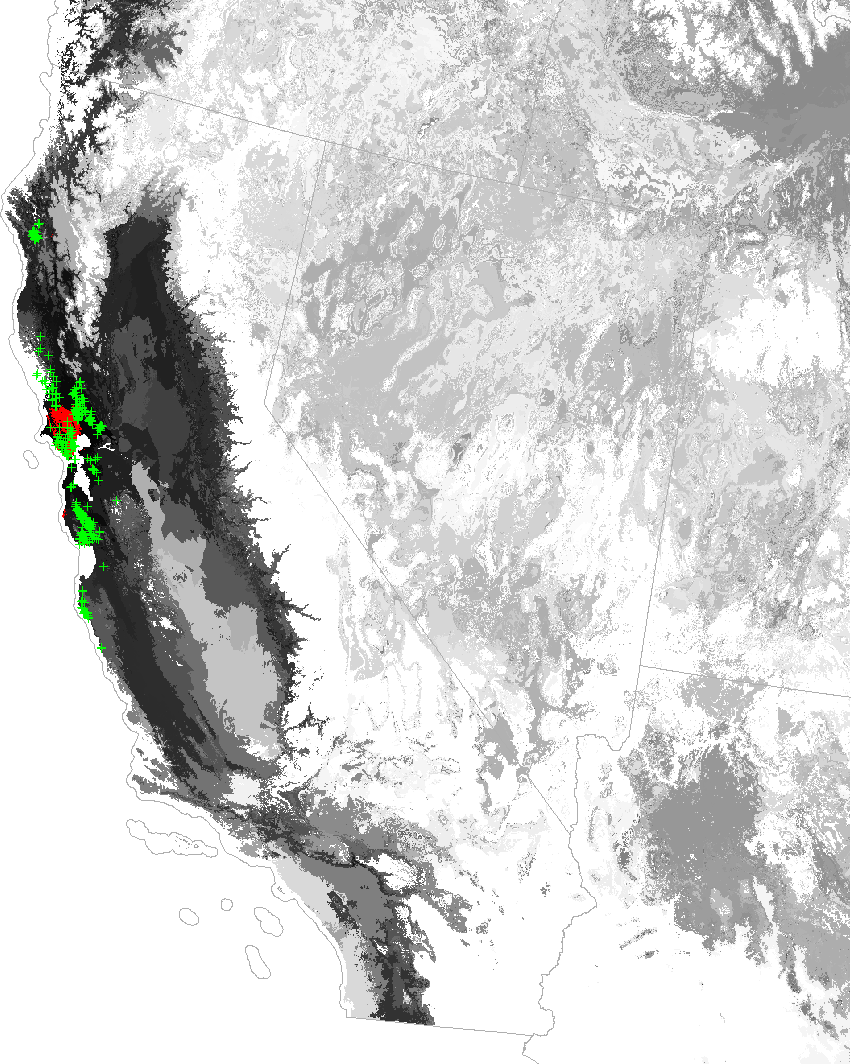
Multivariate similarity to Santa Cruz, CA, including environmental conditions likely to limit growth of potential hosts, according to the 1500 most-different SOD-plus-Host quantitative ecoregions, as a predictor of national SOD susceptibility.
Santa Cruz zoom
When growing conditions for potential hosts are included, fewer areas show a high degree of multivariate similarity to environmental conditions in Santa Cruz.
more coastal specificity. Nevertheless, the pattern is still similar toThe pair of maps below show network analysis calculated based on the 1500 most-different SOD-and-Host ecoregions map.
|
|
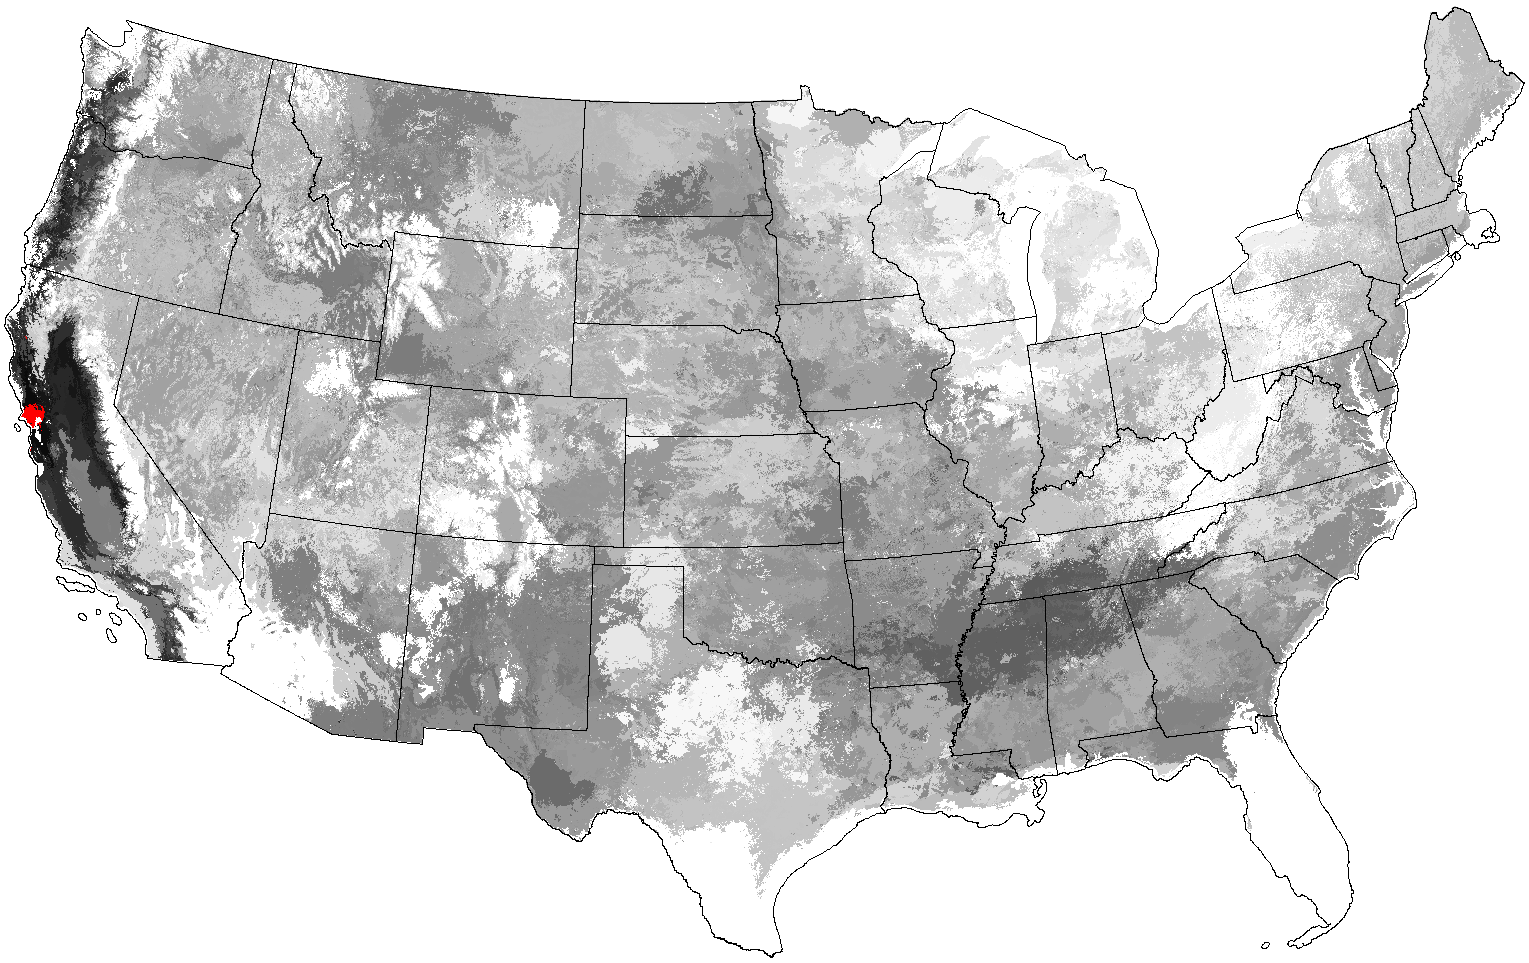
This map represents our most sophisticated prediction for national SOD susceptibility, and includes conditions necessary for likely hosts. This map is also shown at the top of this page.
Susceptibility in the west coast is most susceptible, relative to the rest of the contiguous United States, but there are several areas in central and southern United States predicted to have moderate susceptibility to SOD.
The confirmed SOD outbreak locations, shown in green in the zoomed map at the right, all fall within areas predicted to
 |
| Medium Size Map |
| Large Size Map |
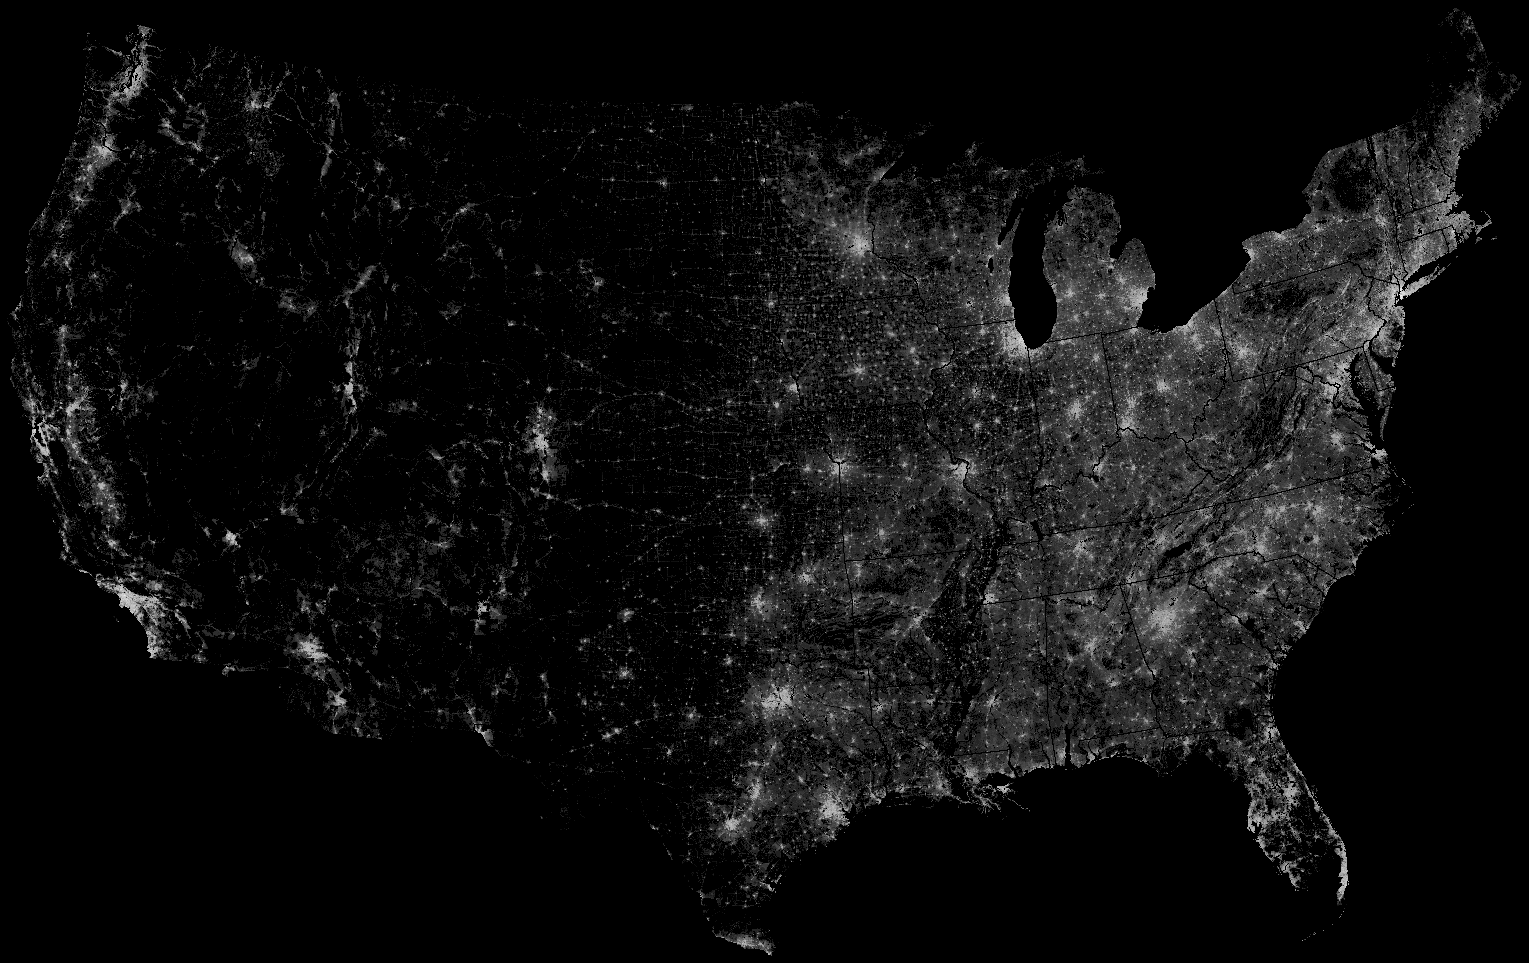
Although the species of eastern foliar-hosts for P. ramorum are unknown, some are likely to be cultivars of horticultural interest, possibly nursery stock. As such, unintentional human-mediated transport is a likely scenario for introduction of SOD. Human population levels are positively correlated with existing confirmed outbreak locations ().
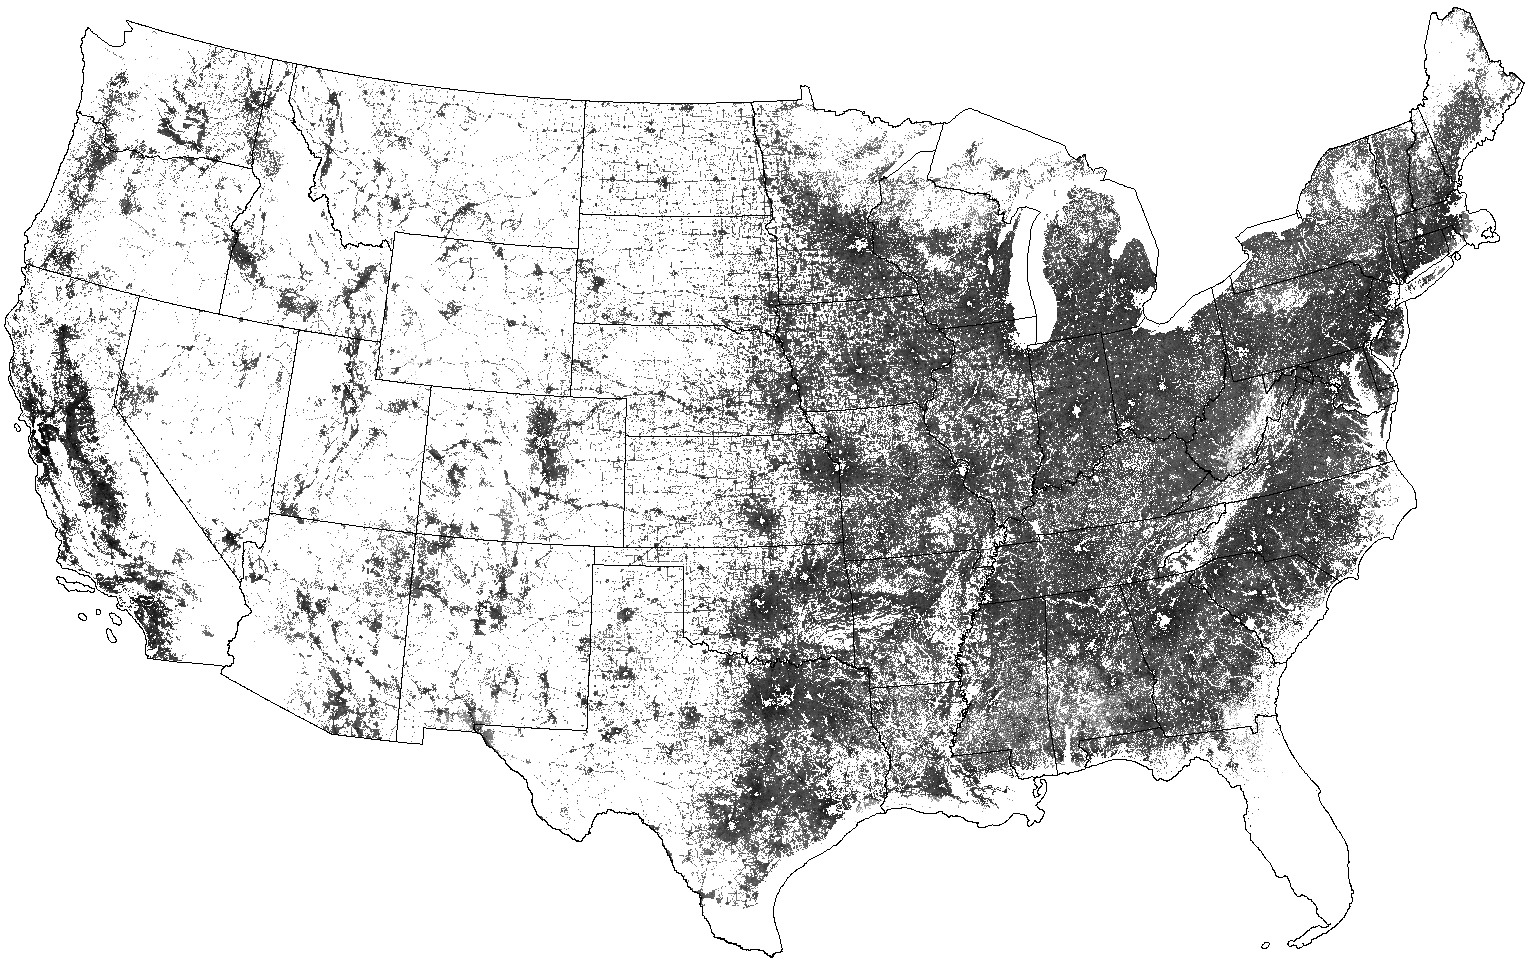
The two susceptibility maps shown above (SOD-only and SOD-plus-Host) represent only biotic susceptibility in the absence of human-mediated spread. We combined the SOD-plus-Host susceptibility prediction with a map of estimated human population density from the LandScan 2004 population database as a first step in converting the national map of SOD susceptibility into a map of SOD Risk of Spread (ROS).
Although this map looks like the DOE nighttime lights image, it is actually a modeled product that has much more information than that. Using a population mass-balance method based on US Census tract data, LandScan spreads the population within a tract based on nighttime lights, slope, and distance from roads, such that the population total is preserved. The gray scale is logarithmic. Much more population detail is seen than in the standard nighttime lights image alone, particularly along roads.
|
|
Because we postulate that increases at smaller population density levels increase SOD ROS the most, we multiplied the SOD-plus-Host susceptibility map by the logarithm of human population density, colored by a logarithmic gray scale. Cities have holes in their urban centers that are predicted to have low susceptibility, and therefore low risk of spread.
The west coast zoomed map at right shows that, although the areas of high SOD ROS are not as extensive as the areas shown in the susceptibility maps, all of the current SOD outbreak locations fall in locations predicted to be high ROS, except for a few of the southernmost SOD outbreaks.
Magarey (2005) reviewed national maps of SOD risk predicted by various models. He identified a consistent national pattern among predictions from the models of high SOD risk in the Pacific Northwest, in the central Appalachian mountains, and low risk through the Great Plains. However, the models differed in predictions for the northern boundary of risk east of the Rockies, and the degree of risk in the southeastern United States. The models presented here used more environmental variables than these earlier models, and many of these variables were created specifically to be SOD-relevant.
We find considerable disagreement among previous predictions of SOD risk relative to the Appalachian mountains. In particular, many of the national risk maps generated by Kelly et al. (2005) indicate lower SOD risk in the Appalachians although they are flanked on each side by high SOD risk areas. These results are consistent with the lower SOD susceptibility and risk predictions in the Appalachians calculated here. Low SOD susceptibility is also predicted for the northern and southern Rockies.
While we predict some SOD susceptibility east of the Cascades, in the Columbia and Snake River canyons, the overall susceptibility in the Pacific Northwest is low. Our model also predicts low SOD susceptibility through the Great Plains, with the exception of parts of the Missouri river drainage through the Dakotas, eastern Nebraska, and eastern Oklahoma, which show considerable susceptibility. Parts of southern Wisconsin, southern Minnesota, and southern Michigan are predicted to show susceptibility, as are parts of Pennsylvania, southern New York, Connecticut, and Massachusetts. The Mississippi valley is predicted to be susceptible to SOD, and so is the southern Coastal plain above the Fall line. Most of the deep south, in southern Alabama, southern Mississippi, and the non-Missippi valley parts of Louisiana, Arkansas, and eastern Texas are not predicted to be highly susceptible to SOD.
Two alternative risk maps predicted for California by Guo et al. (2005) using support-vector machine methods are similar, albeit less extensive, than the SOD ROS map presented here. In particular, our multivariate similarity model, combined with human population density, predicts greater SOD risk in the Central Valley.
These analyses use current locations of SOD outbreaks as training sets to project SOD susceptibility nationally. The accuracy of these results rests on the assumption that the current SOD outbreak locations are a representative sample of the types of environments within which P. ramorum can occur. already in the best, most optimum conditions could be even better growing conditions that the pathogen has simply not yet reached geographically. There could exist growing conditions for SOD in some locations that are even better than those in the worst current outbreak areas. Such differences in conditions with current outbreak areas would cause such as-yet-unreached prime SOD-growing locations to be perceived by our analysis (particularly the initial Marin County-ness and Santa Cruz-ness analyses above) as having lower SOD susceptibility. Comparison with the full network of all known outbreak locations in the second type of analysis reduces the likelihood of this type of error. As the outbreak occurs in more locations, it becomes more likely that these locations represent a good sample of the full range of hospitable growing conditions for P. ramorum.
Guo, Q, M. Kelly, and C.H. Graham. 2005. Support vector machines for predicting distribution of Sudden Oak Death in California. Ecological Modelling 182:75-90.
Hargrove, W.W., and F.M. Hoffman. 2004a. The potential of multivariate quantitative methods for delineation and visualization of ecoregions. Environmental Management 34(5):S39-S60.
Hargrove, W.W., and F.M. Hoffman. 2004. A Flux Atlas for Representativeness and Statistical Extrapolation of the AmeriFlux Network. ORNL Technical Memorandum ORNL/TM-2004/112. Available at http://www.geobabble.org/flux-ecoregions
Hartigan, J.A. 1975. Clustering algorithms. New York: John Wiley & Sons. 351pp.
Meentemeyer, R., D. Rizzo, W. Mark, and E. Lotz. 2004. Mapping the risk of establishment and spread of sudden oak death in California. Forest Ecology and Management 200:195-214.
For additional information contact: