|
William W. Hargrove and Forrest M. Hoffman
A combination of multivariate analysis and ecological expertise was used to create 20 national National Ecological Observatory Network (NEON) Domains. In a subsequent step, groups of researchers within each Domain will prepare Prospecti in which they will advocate particular geographic configurations of sub-node components within their domain. While it is not necessary for a node to represent all of the conditions found within a Domain, configurations which maximize Domain representation will be favored in the selection process.
The same multivariate tools that were used to help create the 20 NEON Domains can also be used to guide the deployment of sub-node components efficiently within each existing NEON Domain in the continental United States. The initial basis for NEON Domain development was a map produced by a multivariate clustering process using nine climatic variables as inputs. Each climatic variable is itself a map at 1 km2 resolution over the conterminous United States, consisting of nearly 8 million cells.
An initial proof-of-concept analysis of within-domain representativeness, based on the same nine climatic variables used to help delineate the NEON domains, has been described at http://research.esd.ornl.gov/~hnw/neon/withindomainrep. Although each map cell is unequivocally classified as a member of only one region, the degree of "belongingness" of each map cell to its final group can be quantified. Hargrove and Hoffman (1999) used the Euclidean distance between each map cell and the centroid of the cluster to which it was assigned in the multidimensional data space as an index of each cell's within-group (or within-region) representativeness. Map cells that lie close to the Domain centroid in data space are good representatives of the average or nominative conditions for that Domain. However, map cells that lie far from the Domain centroid are located on the outer periphery of that data cluster, and more poorly represent conditions typical for that Domain. Such peripheral map cells might have changed cluster assignment in subsequent iterations of the classification algorithm.
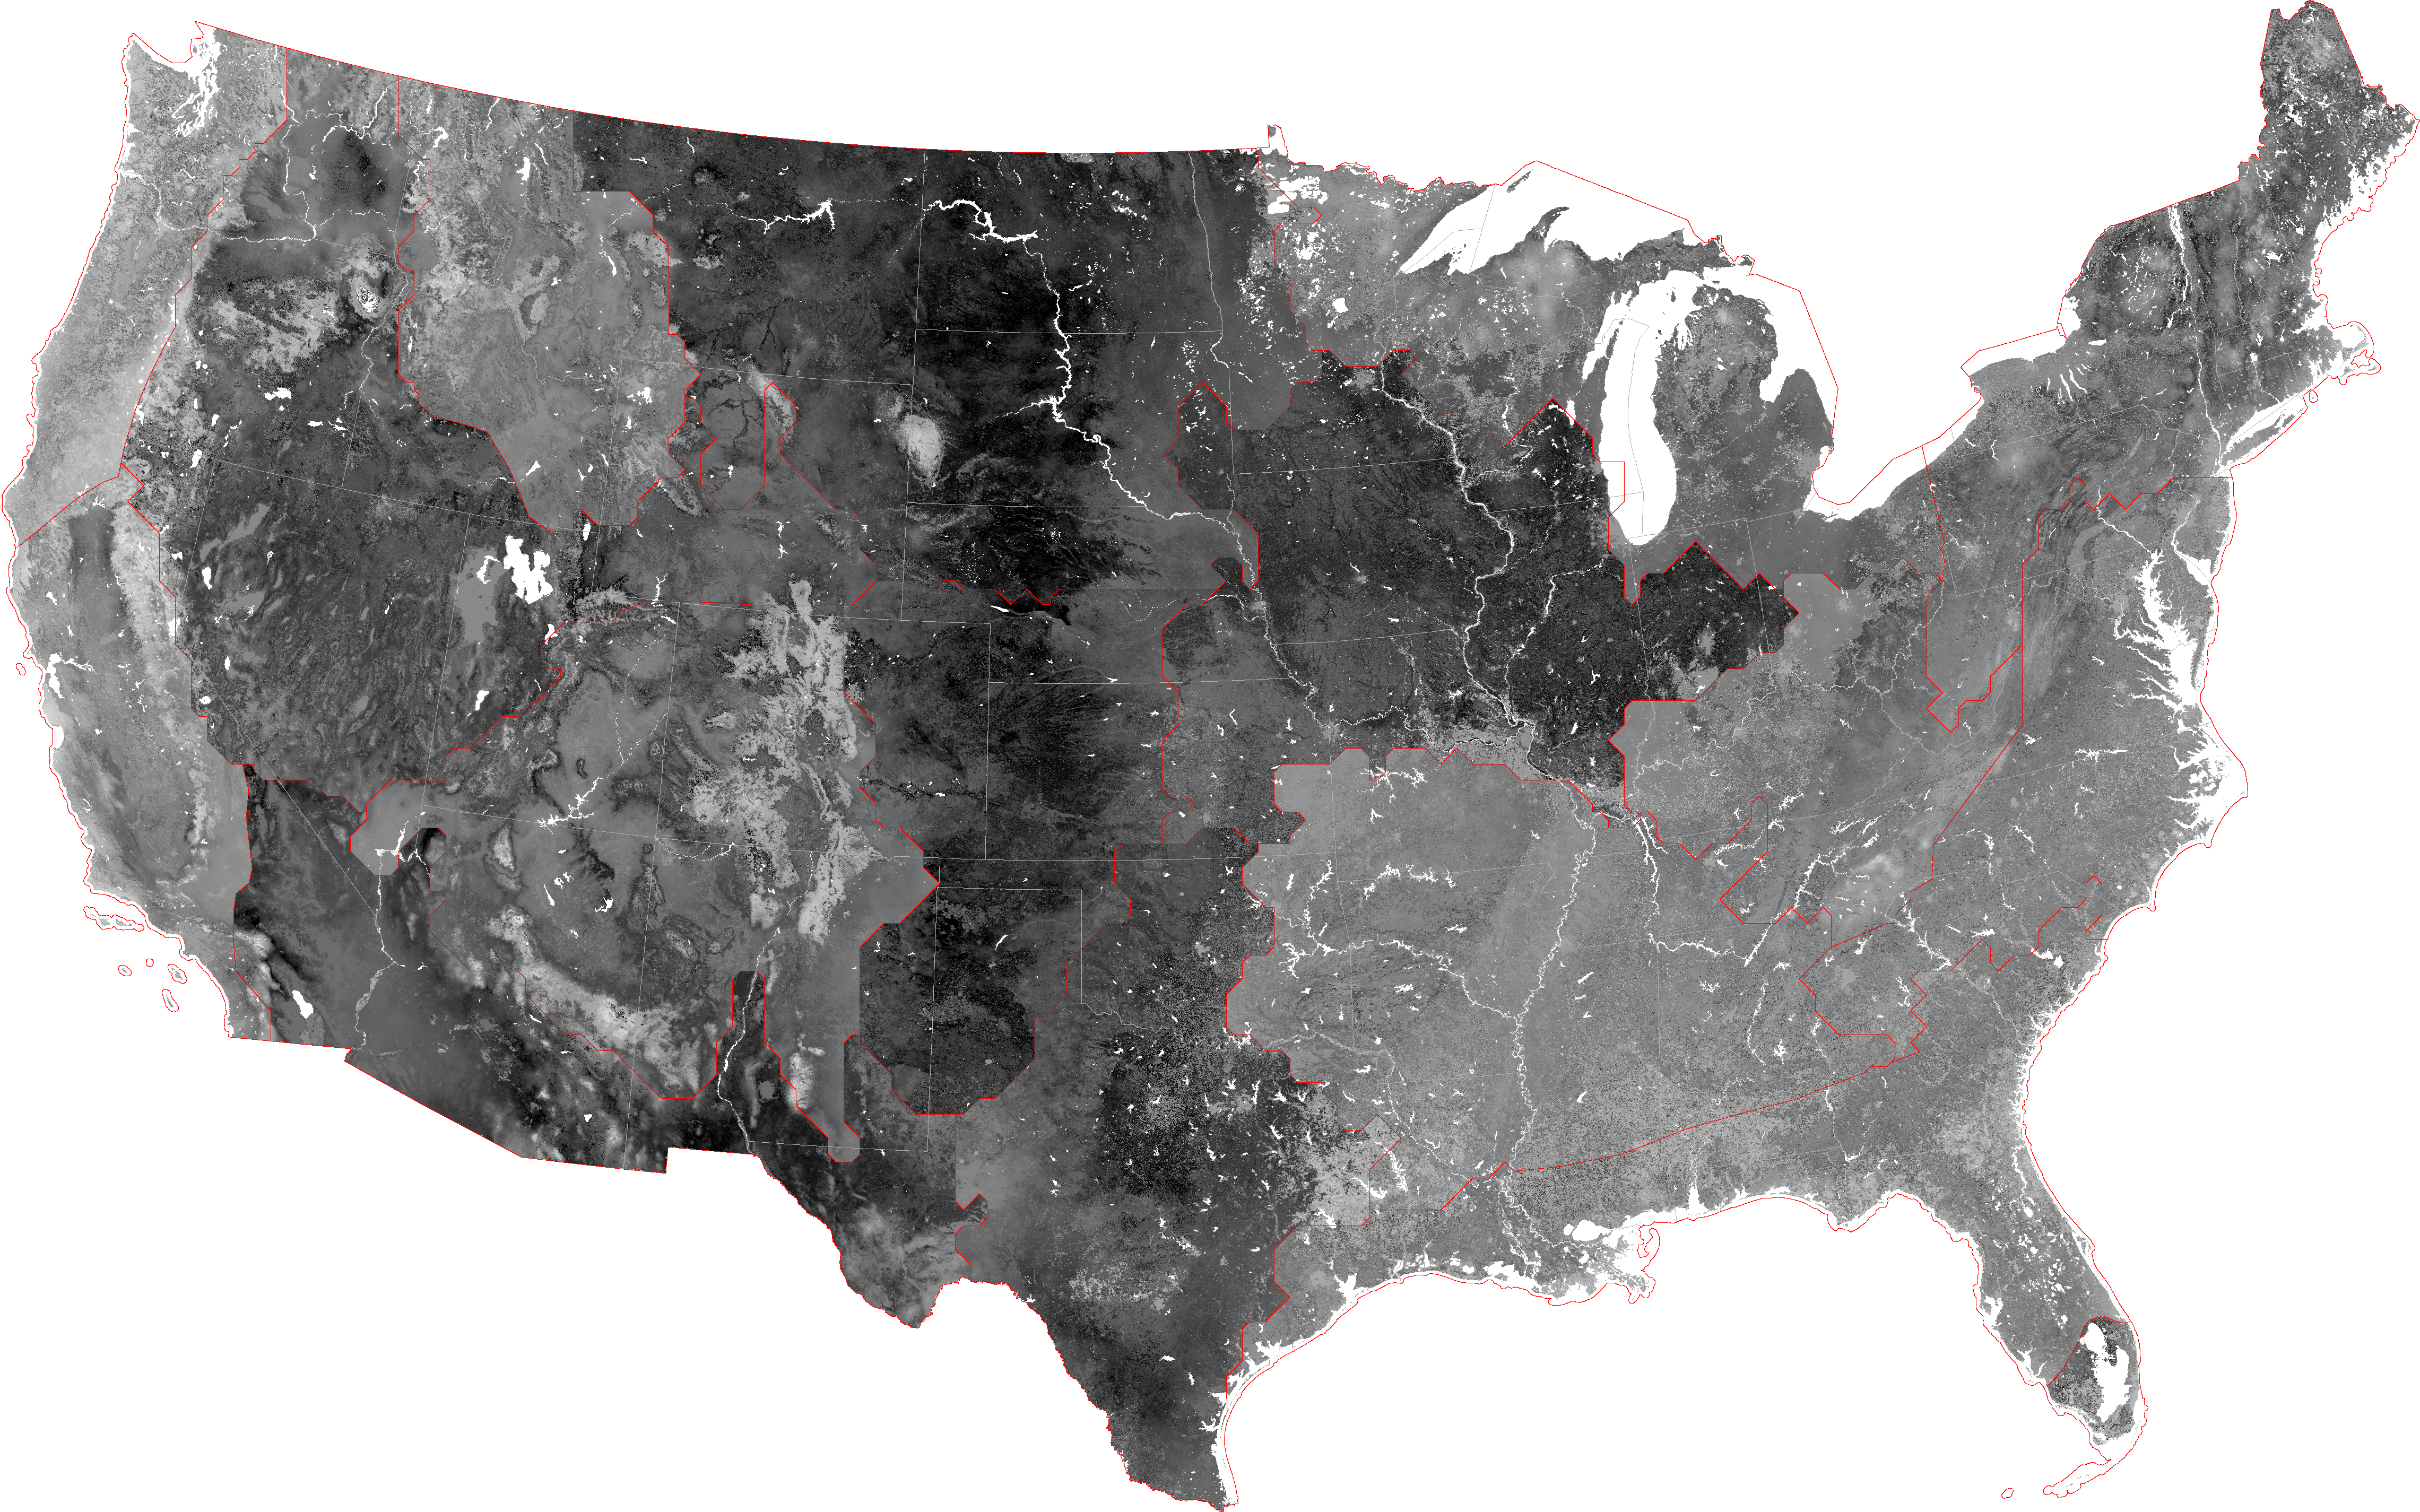
The centroids of the final adjusted NEON Domains were empirically calculated, and the representativeness of each location were depicted as mapped gray levels. A centroid was calculated for every NEON Domain as the mean of each coordinate of every map cell that is a member of that NEON Domain. This Domain centroid represents the mean combination of conditions for that NEON Domain. This synoptic or nominative combination may not actually be represented by any map cell within that Domain.
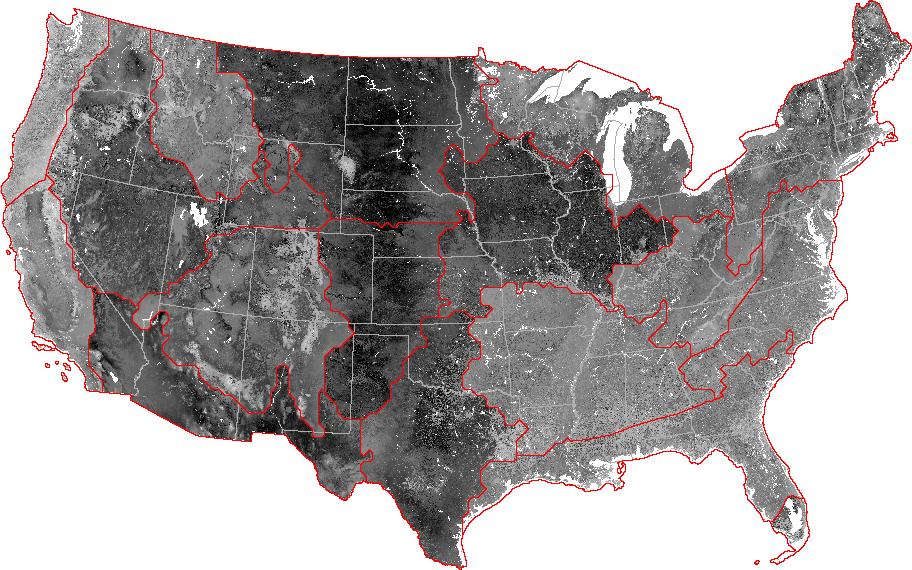
We calculated the Euclidean distance from each map cell to the empirical centroid of the NEON Domain to which it was assigned, within an orthogonal, nine-dimensional PCA space. We mapped these distances as log-transformed gray levels. The resulting map shows areas which are highly representative of climatic conditions within their Domains as dark gray, while areas which are poorly representative are lighter gray.
Blacker areas, as locations typifying Domain-wide conditions, would be good candidate locations for sub-node components (assuming that separation distance and other NEON criteria were met). Alternatively, an argument could be made that particular lighter gray areas, as important Domain "outliers," need to be sampled as well.
NEON within-domain representativeness analyses have been completed with respect to four sets of ecological variables: soil/landform properties, characteristics of existing vegetation, ecosystem productivity, and all of these combined, plus human population density. The visualization method used in output maps showing the degree of representativeness within each domain was improved, creating greater dynamic range of contrast, and the original proof-of-principle analysis using the same nine climate variables originally used to create the NEON domains was re-mapped using this improved method.
 NEON Within-Domain Climatic Representativeness Variables Used Small Map Medium Map Large Map Huge Map GeoTiff Image |
 NEON Within-Domain Soil/Landform Representativeness Variables Used Small Map Medium Map Large Map Huge Map GeoTiff Image |
 NEON Within-Domain Existing Vegetation Representativeness Variables Used Small Map Medium Map Large Map Huge Map GeoTiff Image |
 NEON Within-Domain Ecosystem Performance Representativeness Variables Used Small Map Medium Map Large Map Huge Map GeoTiff Image |
 NEON Within-Domain Comprehensive Representativeness Variables Used Small Map Medium Map Large Map Huge Map GeoTiff Image |
Results indicate that NEON domains vary widely in terms of the representativeness of their soils and landforms. The northern half of the Central Plains represents the soils of this domain well, whereas areas representing the soils/landforms of the Pacific Northwest, the Ozark Complex, and the Southeast are more localized. These localized areas with representative soils, unlike the representative climatic areas, are not necessarily located near the geographic centers of their NEON domains. For example, the northeastern corner of the Appalachian/Cumberland Plateau domain is the most representative of this domain's soils and landforms.
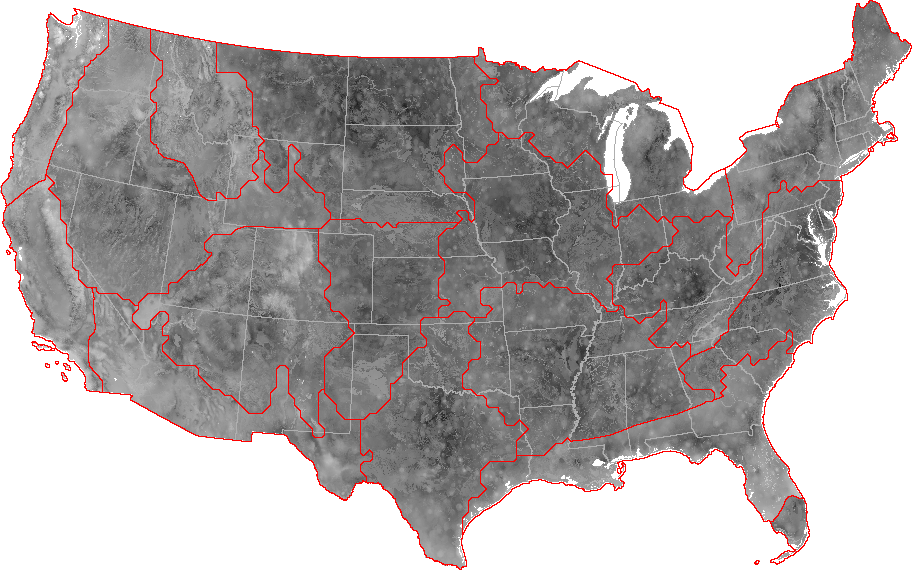
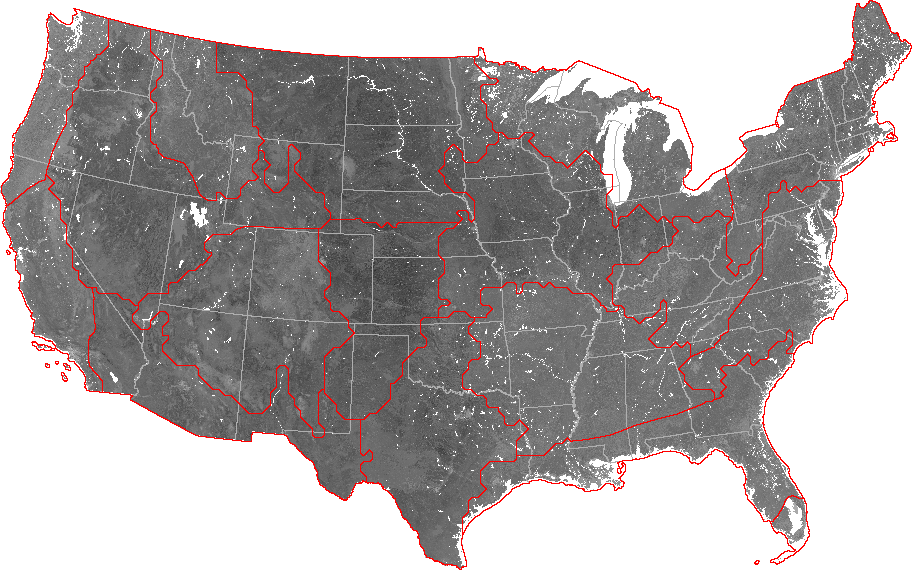
The Northern, Central, and Southern Great Plains, the Prairie Peninsula, and the Great Basin are all well-represented in terms of existing vegetation, as measured by MODIS satellite. These results are consistent with expectations; the relatively uniform grassland vegetation of the Great Plains, and the uniform crops of the agriculturally intensive Prairie Peninsula make many areas highly representative of the vegetation in these domains. Vegetative representativeness is more restricted, but also fairly high within the Southern Rocky Mountains and the Desert Southwest. Areas representative of vegetation within the Southern Rocky Mountain domain are limited to a particular elevation band. It is difficult to find locations that are representative in terms of existing vegetation within the other NEON domains. Notably, there are very few representative locations within any of the eastern NEON domains, with the exception of the Prairie Peninsula. High population density and intensive land use have widely diversified the existing vegetation within these NEON domains.
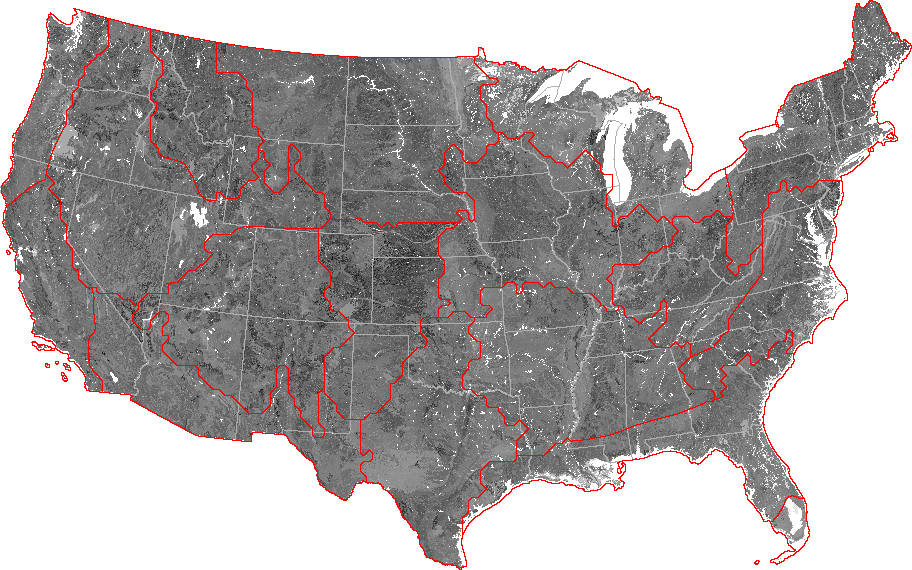
Although based on completely different variables, representativeness within NEON domains in terms of ecosystem productivity strongly resembles that of existing vegetation. This result makes sense, since dominant vegetation is responsible for most of the GPP and autotrophic respiration within the terrestrial ecosystem. Again the Southern and Central Plains are well-represented by many locations, as are the agricultural areas of the Prairie Peninsula. The Black Hills are conspicuously different from the remainder of the Northern Central Plains. The Desert Southwest and the Atlantic Neotropical domains show more representative locations in terms of ecosystem productivity than in terms of vegetation characteristics alone. Still, the overall consistency of these two vegetation-based representativeness analyses is both intuitive and reassuring.
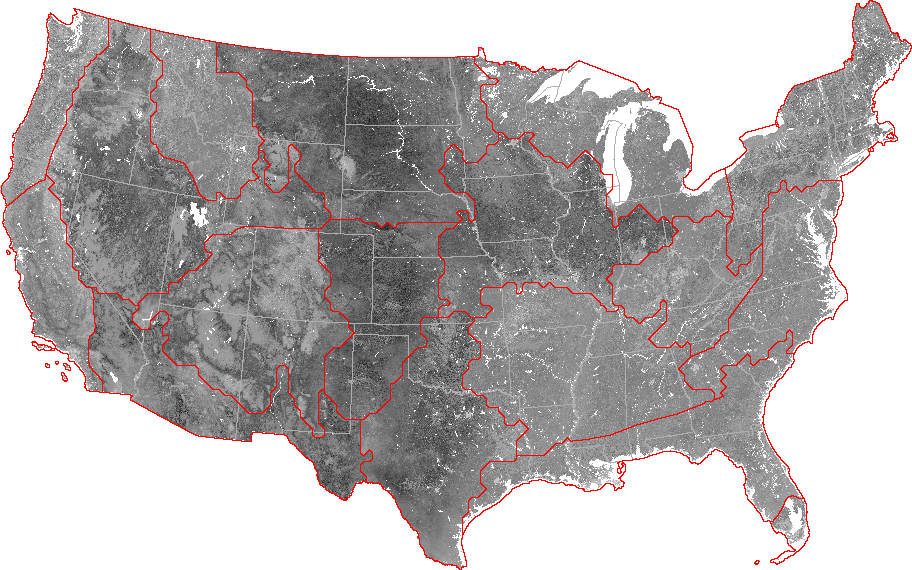
Considering soil/landform, existing vegetation, and ecosystem performance all at once, and adding in human population density, produces a map in which no areas have particularly high representativeness within any NEON domain. The slight differences in within-domain representativeness that do exist strongly resemble the patterns obtained with the two vegetation-based data sets. The simultaneous juxtaposition of so many disparate classes of variables makes it difficult for any single location to be highly representative of its mother domain. As more and more environmental characteristics are included in the analysis, the overall representativeness that can be achieved by a single site decreases. This result reminds us that it will not be possible to completely optimize the final selection of NEON sites, and that any selection will be a compromise.
Many of the sets of variables analyzed here produced within-domain representativeness that changes dramatically at the borders between adjacent NEON domains. While within-domain climatic representativeness, from the initial analysis, tended to be highest near the geographic centers of the climatically defined NEON domains, the highest within-domain representativeness is often near the domain edges in terms of sets of variables other than those upon which the domains themselves are based.
This type of analysis can also be used to find "core" areas of good representativeness for any existing set of regions or polygons. For example, "core" areas could be found for each of the Omernik or Bailey ecoregions, for a particular vegetation cover or land-use type, for a particular soil type, or even for a particular state or county, based on any desired set of environmental descriptors.
Hargrove, W.W., and F.M. Hoffman. 1999. Using multivariate clustering to characterize ecoregion borders. Computers in Science and Engineering 1(4):18-25. Invited. Special Issue on Scientific Visualization of Massive Data Sets. Also available with additional figures at http://research.esd.ornl.gov/~hnw/borders
Hargrove, W.W., and F.M. Hoffman. 2004. The potential of multivariate quantitative methods for delineation and visualization of ecoregions. Environmental Management 34(5):S39-S60.