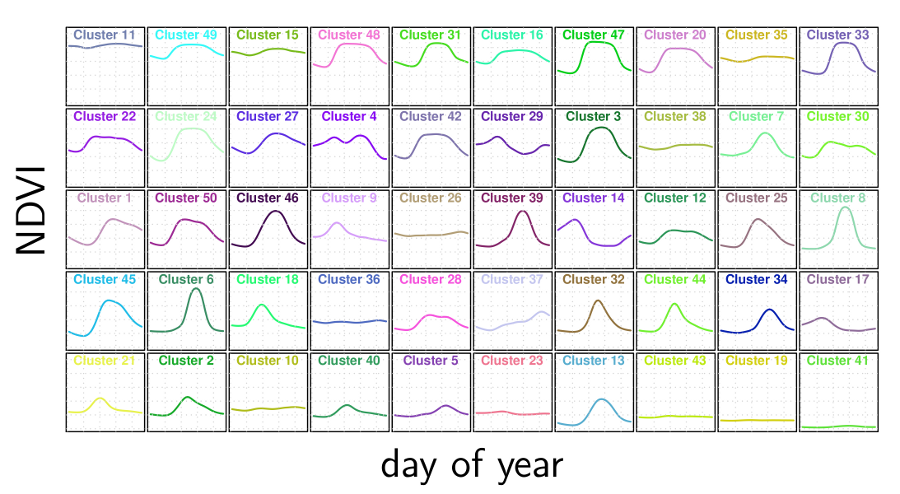
Synoptic Annual Phenology Profiles for Each of the 50 National Phenoregions
Sorted by Area Under the Curve - Proportional to Gross Primary Production
Colors match the Previous Map
The "Paint Chips" Display