Major Research Projects
(1) The EMBYR wildfire
model
From 1991-1993 I developed a spatially-explicit grid-based forest fire model,
EMBYR (Ecological Model for Burning the Yellowstone Region), for simulating
wildfire in Yellowstone National Park, USA. EMBYR is a
probabilistic model that predicts potential burn patterns of large fires relative to
variations in fuel types and weather patterns in an area. Ignitions can occur
at random points or specific locations, and ignitions from firebrands can be
simulated relative to fuel type. EMBYR requires a GIS layer of fuel
types based upon age classes and species composition. Fire spread probabilities
are specified for three possible fuel moisture conditions; wet, intermediate, or dry.
Probabilities are then adjusted using one of three wind speed categories and one of
eight wind directions. The output from EMBYR indicates the final burn
pattern of one or more potential landscape-scale fires allowing impacts from future
fires to be estimated. The spatial resolution is
50m. EMBYR is easily parameterized, fast and efficient, and shows
interactions between landscape pattern and process. EMBYR development
was sponsored by the National Science Foundation (NSF) under "Causes and Consequences
of Large-Scale Fires" (web page describing early results
here, source code available here, see Publication #36 describing the
EMBYR model and its behavior, with 181 citations).
In 1994, Bob Gardner (ORNL staff) and I used EMBYR to simulate the wildfire
regime over the next millennium for the Greater Yellowstone Ecosystem under three
alternative synthetic fractally-generated climate scenarios: dry, moderate, and
wet. Fuel growth and tree succession under each scenario were simulated by a
Markov transition probability model. We performed 10 replications of 1000 years
into the future for each of the three climate scenarios (see Publication #17, with
327 citations). Total area burned each year was nearly constant, regardless of
the climate; only the average size and intensity of the wildfires changed
In a series of three papers (Agricultural and Forest Meteorology 1998, Ecological
Modeling 2004, and Landscape Ecology 2006), Bob Keane of USDA Forest Service,
Missoula Fire Lab, and G.J. Cary of the Canadian Forest Service independently
compared and evaluated the sensitivity of the EMBYR model with four other
wildfire simulation models (FIRESCAPE, LANDSUM, SEM-LAND, and
LAMOS(DS)). EMBYR was found to be one of the most sensitive
models to landscape fuel patterns, in terms of changes in area burned.
In 2004, Town Peterson and I used a modified version of EMBYR to predict the
spread of Asiatic longhorned beetle, Anoplophora glabripennis, across its
suitable range within the United States, as modeled by the GARP (Genetic
Algorithm for Ruleset Prediction) niche model. EMBYR provided an
excellent parallel to species dispersal; fires spread via ignition of adjacent areas,
and also through longer-distance dispersal by means of ‘firebrands’
— similar to the ways that an invasive species spreads across a landscape.
Our parameterization of the EMBYR was only intended to assess the
spatial pattern of invading populations, not the actual rates of spread. We
initiated the EMBYR spread model at 32 known points of warehouse or tree
infestation in North America (see Publication # 51, with 227 citations). This
is a Modeling and Knowledge Development Accomplishment.
(2) The Fractal Realizer and
MapCurves
In 1997, I devised and programmed the Fractal Landscape Realizer, which
generates synthetic landscape maps to
user specifications. The alternative landscape realizations are not
identical to the actual maps after which they are patterned, but are similar
statistically (i.e., the areas and fractal character of each category are
replicated). A fractal or self-similar pattern generator is used to provide a
spatial probability surface for each category in the synthetic map. The
Fractal Realizer preserves the fractal patterns of all the categories in the
resulting synthetic landscape. Each synthetic landscape is one realization from
among an infinite ensemble of possible fractal landscape map combinations. One
can use the Fractal Landscape Realizer to simulate an actual example landscape
on-the-fly at http://www.geobabble.org/cgi-bin/realizer/turing-map?3.
Click reload to generate another custom synthetic landscape. Every realization
is new and different.
The Fractal Realizer is useful as a generator of “neutral models”
against which to test for the presence of natural spatial patterns. The
Fractal Realizer generates null models in the absence of any structuring
process, or using well-defined structuring processes which are under the users'
control. Replicate landscape maps generated using the Fractal Realizer
all possess statistical properties that are similar to a particular empirical
landscape, and these synthetic maps can provide a baseline upon which to simulate
natural processes in order to predict or test for expected pattern. The
sensitivity of stochastic spatial simulations to prescribed input landscapes can be
evaluated by supplying them with a series of synthetic maps that obey particular
statistical characteristics and by monitoring changes in selected output
responses. Statistically similar input landscapes with different spatial
arrangements can be generated and supplied to spatial models as a hedge against
pseudoreplication.
The quality of synthetic landscapes produced by the Fractal Realizer was
tested using an online variant of the Turing Test. More than 1000 ecologists
and mapping specialists were presented over the web with a series of 20 selections of
paired maps, and asked to distinguish the real map from the synthetic realization
from the Fractal Realizer. The resulting population of scores was
not significantly different from a random binomial, proving that the experts were
unable to discern the synthetic maps from the actual ones. Anyone can take the
test at any time over the web at http://www.geobabble.org/realizer/turing.html
Since its publication in 2002, many thousands of people have taken the Turing Test of
the Fractal Realizer. Several landscape ecology and GIS classes across
the country have made the Turing Test of the Fractal Realizer a regular part
of their scheduled laboratory exercises each year, and source code for the Fractal Realizer is
available for download over the web. In April 2004, I was awarded the
Outstanding Landscape Ecology Paper by the International Association of Landscape
Ecology (IALE) for the publication in Conservation Ecology describing the
Fractal Realizer (see Publication #46, http://www.ecologyandsociety.org/vol6/iss1/art2/)
In 2005, I developed MapCurves, a generalized algorithm
for the quantitative, comparison of
multiple categorical maps. MapCurves is a quantitative
goodness-of-fit (GOF) method that unambiguously shows the degree of spatial
concordance between two or more categorical maps. MapCurves graphically
and quantitatively evaluates the degree of fit among any number of categorical maps
and quantifies a GOF for each polygon, as well as for the entire map. The
MapCurves method will even indicate a perfect fit between ecoregion maps drawn
by a “lumper” and a “splitter,” e.g., if all ecoregions in
one map are comprised of unique sets of smaller ecoregions in the other map, so long
as the spatial coincidence among the lumped and split ecorgegion categories is
perfect. It is not necessary to interpret (or even know) legend descriptors for
the categories in the maps to be compared, since the degree of fit in the spatial
overlay alone forms the basis for the comparison. MapCurves produces the
best translation table between categories in each map as an output product rather
than starting with a translation table as an input. Prior to MapCurves,
meaningful quantitative comparison of two categorical maps was nearly
impossible. One can compare two or more ecoregion maps using MapCurves,
even if the maps contain radically different numbers of ecoregions. Two dozen well-known
ecoregion and landcover maps were compared quantitatively using MapCurves (see
Publication #59). One can also use MapCurves to “borrow” and
apply the best, most appropriate labels (of ecoregions or forest types, for example)
from another map.
(3) Clustering Quantitative
Ecoregions and LANDFIRE National Wildfire Biophysical Settings
Map
About 1997 I started experimenting with multivariate clustering as a way to
statistically delineate homogeneous ecoregions, using a set of digital maps within a
GIS as ecoregion characteristics. While recognizing the utility and popularity
of ecoregions among ecologists, I was dissatisfied with the reliance on human experts
and expertise to produce them. I quickly realized that multivariate clustering
represented a quantitative alternative that was transparent, objective, and
repeatable. The algorithm was computationally demanding, however, mostly
because of the large data volumes involved. This computational need drove my
research interest in the Stone Soupercomputer
(see Factor 3C and Publication #40).
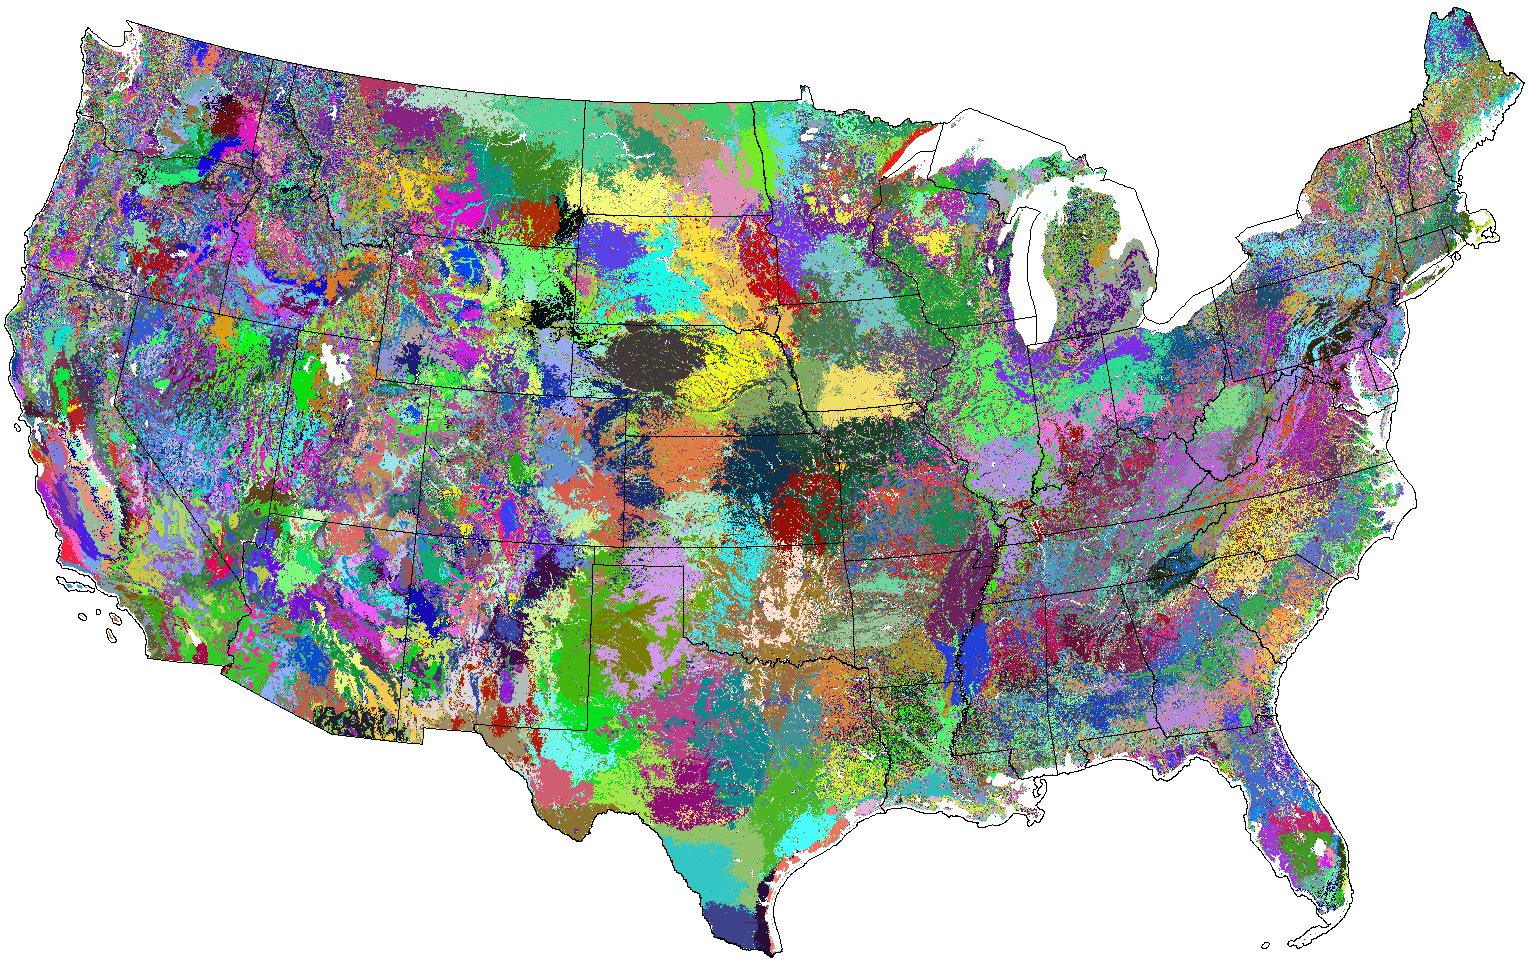
In 1999, I produced a national
map of 1000 ecoregions created quantitatively by statistically clustering nine
environmental variables, including physiographic, edaphic, and climatic variables
at 1-km resolution. I also created a total soil Kjeldahl nitrogen map for the
continental United States at 1-km resolution by combining non-agricultural data from
the National Soils Characterization Database (NSCD) and STATSGO. I realized
that the sharpness or fuzziness of
ecological borders, or ecotones, between ecoregions could be quantitatively
characterized, even if it changes along the length of the border (see Publication
#27, with 57 citations). I collaborated with others to link disparate tree
physiology models to simulate tree growth across spatial scales (from leaf to stand
to regions of stands), using forcing functions to drive models at larger scales
(i.e., across
the southeastern US, see Publication #44). Ironically, this Integrated
Modeling Project was initially sponsored by Steve McNulty of the Southern Global
Change Program, USDA Forest Service, which is now a part of EFETAC, my own current
Forest Service unit. (Exhibit #1, Publication #53, with 100 citations)
In 2003, I developed the first quantitative global ecoregion maps, sponsored by and
in coordination with The Nature Conservancy (TNC). Quantitative ecoregions were
statistically generated for both current global environmental conditions and future
environments, as predicted for 2050 and 2100 by two global climate models under two
possible future scenarios (http://www.geobabble.org/~hnw/global/ORNL-TNC/index.simcolors.html).
In 2005, also with TNC, we developed the first quantitative ecoregion maps for
Papua, New Guinea and China (see Publication #83, with 58 citations). These
defensible and repeatable quantitative global ecoregions can be used to prioritize
ecological preservation and restoration worldwide.
Using the same statistical quantitative ecoregion method, I was funded by the USDA
Forest Service LANDFIRE project to produce a set of national wildfire biophysical
regions to measure departure of ecosystems from their potential vegetation state for
wildfire management (http://www.geobabble.org/~hnw/landfire/).
Forrest Hoffman and I also designed and constructed a 136-node, 272-processor
parallel supercomputer for the LANDFIRE, project, and most official LANDFIRE
products were produced using this parallel machine.
Parallel Multivariate Geographic Clustering has become one focus of my research, and
I have developed this quantitative approach into a rich and powerful quantitative
statistical foundation that underlies many of my subsequent future achievements,
including Scientific Accomplishments 4, 5, and 7 listed here. Spatial
Clustering has proven to be a fertile recurrent theme throughout my research, and
continues to be a thread of continuity throughout my scientific career. This is
a Knowledge Discovery and Knowledge Development Accomplishment.
(4) Network Analysis, Including
AmeriFlux and NEON Designs
When ecoregions are delineated using quantitative methods rather than expert judgment
(see Scientific Accomplishment 3, above), the quantitative treatment provides a
number of ecologically useful related concepts. Two of the most interesting of
these are representativeness, which allows maps to be drawn which show the geographic
location of all regions which are similar to a selected ecoregion, and network site
analysis, which shows how well a particular network of sites represents a larger area
containing the network.
These concepts are of great practical use in the design and analysis of networks of
installations or sample locations. Once input variables of appropriate
relevance, scale and quality are chosen, the coverage and sampling intensity of any
network of sites can be analyzed statistically with respect to those selected
variables. Because the ecoregions are statistically derived, one can select a
single ecoregion of particular interest, and then produce a sorted vector of the
similarity of all other ecoregions to the selected one. Coding these pairwise
similarity values as gray levels, a map can be drawn which cartographically shows the
degree of similarity of all ecoregions in the map to the selected ecoregion of
interest. Such maps show the degree of innate
multivariate similarity between a particular selected ecoregion and the rest of the
map.
This similarity concept can also be used to quantify how well a particular
established network represents all of the conditions occurring within a map that
contains it. A network in this sense consists of a geographic constellation of
installations or facilities, or can simply represent locations where samples have
been (or will be) taken. The quantitative similarity is now based on
comparisons with multiple site locations within the established (or planned)
network.
The best location for adding an additional new site or installation will be shown as
the place that is the least well-represented by the current network of existing
sites. Importance values for each site can be calculated, based on the marginal
representation it adds to the network. Such importance values can be used to
minimize the impact on representation if a site must be removed from the
network. Finally, a network with a given number of sites can be designed which
is theoretically optimum, having the highest possible representation on the
map.
Until now, sites in even large-budget networks have been established in
opportunistic, political, or logistically-driven ways, resulting in undirected,
organic growth. Network analysis is simple, quantitative and defensible, and
provides the first objective guidance for network design and evaluation (http://www.geobabble.org/~hnw/networks/).
I initially used this approach to determine the degree to which the existing network
of carbon eddy flux towers within the AmeriFlux network are representative of
flux environments across the conterminous United States (http://www.geobabble.org/~hnw/networks2/).
This network representativeness information was used to determine how many additional
AmeriFlux towers will be required, and where additional towers should be
placed. In addition, the importance and uniqueness of each existing tower to
the Ameriflux network were calculated. This quantitative ecoregion-based
approach to stratifying carbon flux may be the fastest way to fulfill the North
American Carbon Program (NACP) and AmeriFlux goals of seasonally
mapping sources and sinks of carbon within the North American continent.
Sponsored initially by the Office of
Biological and Ecological Research (OBER), DOE, I soon received additional funding
from AmeriFlux to continue this AmeriFlux
network analysis, resulting in Publications #48 and
#50.
After 8 years of additional tower site additions and losses within AmeriFlux,
Beverly (Bev) Law, the director of AmeriFlux, called and asked me early in
2011 if I would repeat this analysis for the current configuration of the
AmeriFlux network. Although I now worked for the Forest Service, I
repeated the AmeriFlux network analysis, and the results were presented at the
2011 annual AmeriFlux meeting (See Exhibit #3, letter 2). A manuscript
is being prepared to publish these updated AmeriFlux network
representativeness results.
Because of the development of these research capabilities, I became involved with the
early design of National Ecological Observatory Network
(NEON). NEON will be the first ecological
measurement system designed to answer regional- to national-scale scientific
questions. A system of identical nodes was envisioned, each representing the
ecological environments within a mother geographic "domain." All nodes are
focused in unison on a few transformational ecological questions of national
relevance. To better sample a phenomenon as diverse as the ecological
environments of the United States, those environments were first divided into a set
of more homogeneous "strata." NEON nodes could then be located
within each stratum, helping to ensure that their measurements can be
scaled up to represent the entire range of environments within the United
States. Multivariate
clustering based on national maps of 9 ecologically relevant climatic "state"
variables was used to repeatably define 25 national climatic zones. These
25 climate zones were combined with dynamic air mass seasonality data to create
20
NEON domains, each having relatively homogeneous climate.
I was invited to become a member of the 15-person NEON National Network Design
Committee (NNDC), which met two dozen times over a period of 4 years. The NNDC
was responsible for drafting the Integrated Science and Education Plan, the
Networking and Informatics Baseline Design, and the Project Execution Plan (PEP) for
NEON. I was also involved in the NEON Conceptual Design Review (CDR). These
reports and review results were given to the National Science Foundation and the U.S.
Congress, which has now funded NEON for the initial build-out phase.
Using the quantitative ecoregions and optimal network design, I suggested the
national regionalization on which the 20 official NEON domains are now
based (http://www.geobabble.org/~hnw/neon/neonindex/).
I was also an invited member of the 10-person Land Use Subcommittee of the
NEON Science and Human Dimensions Committee. These efforts resulted in
Publications #65 and #69, and a more detailed description of the history of
development of the official
NEON domains map is being currently prepared for publication.
NEON broke ground in June 2012, starting construction of its first two sites
(See Exhibit #3, letter 1).
Now we have been funded by the Office of Biological and Environmental Research (OBER)
within the Department of Energy’s Office of Science to use this network
analysis to analyze DOE’s two new Next
Generation Ecosystem Experiments (NGEE)-Arctic Alaskan Climate Change ecosystem
warming sites, to study the placement of the sites within Alaska, and the
representativeness of their measurements. NGEE-Arctic is a major new 10-year,
$8M DOE research effort. DOE may also establish an NGEE-Tropics
Program, with multiple sites in equatorial locations.
(5) Invasive Species Predictions
for the Great Lakes and Sudden Oak Death
Hired as a consultant by the Environmental
Protection Agency (EPA), I predicted the exotic aquatic organisms most likely to
invade the Great Lakes from the Ponto-Caspian Sea region. I identified the most
likely aquatic invaders across all taxa, and predicted the geographic extent of the
potentially susceptible areas for each species within the Great Lakes (See Exhibit
#3, letter 3).
Aquatic invasive species are transported with normal ship
traffic, often carried in ballast water. This study predicted susceptibility by
quantifying the degree of multivariate similarity of aquatic environments worldwide
to selected locations within the Great Lakes, USA. The approach assumes that,
sooner or later, transport of invasive aquatic organisms will occur to and from all
points on the globe. Following such human-mediated accidental transplantations,
it is the degree of similarity of the new aquatic environment to the original
environment that determines whether the invader will successfully establish a
population in the new location.
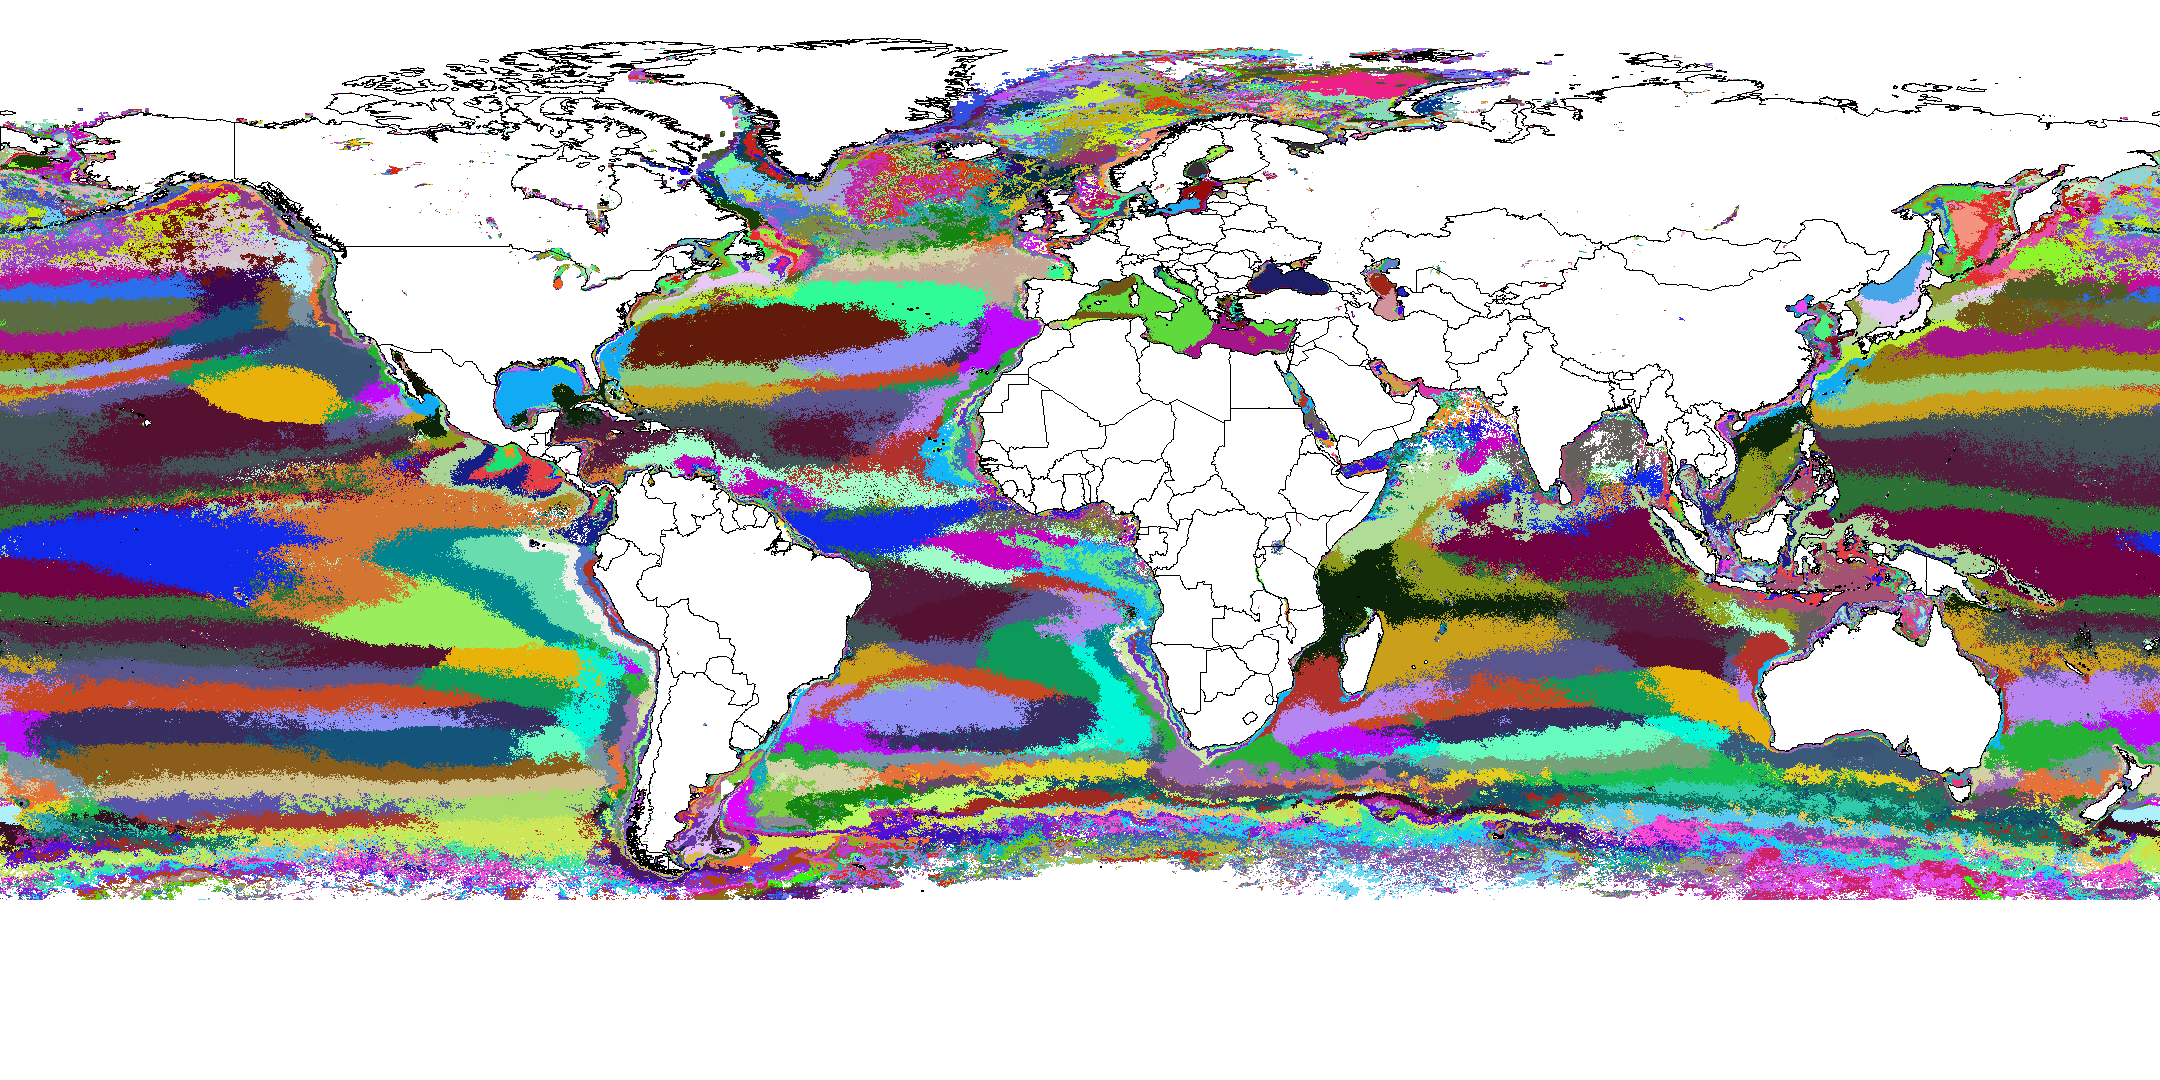
We produced multiple sets of aquatic ecoregions, based on six characteristics of the
surface aquatic environment. Using Multivariate Geographic Clustering (MGC) on
a parallel supercomputer, we grouped over 50M 4 km map cells into groups or clusters
having similar combinations of the six environmental conditions. When placed
back into geographic map space, these groups form geographic regions across all
global aquatic habitats which share similar environmental conditions (http://www.geobabble.org/~hnw/global/aquaticinvaders/,
aquaticinvaders2).
Because the ecoregionalization process is quantitative, a world map can be drawn in
which the degree of multivariate similarity between the aquatic environment in the
selected location and the aquatic environment in every other location is shown as a
shade of gray. By quantifying the similarity between aquatic environments, such
maps show both the locations from which aquatic invasive organisms that are
likely to survive here might come, and locations to which invasive
aquatic forms from this location might go and establish a viable population (aquaticinvaders3 and
aquaticinvaders4).
Using this similarity-based approach, it is not necessary to select particular donor
and recipient locations, nor to do the analysis on a tedious species-by-species basis
(see Publication #76).
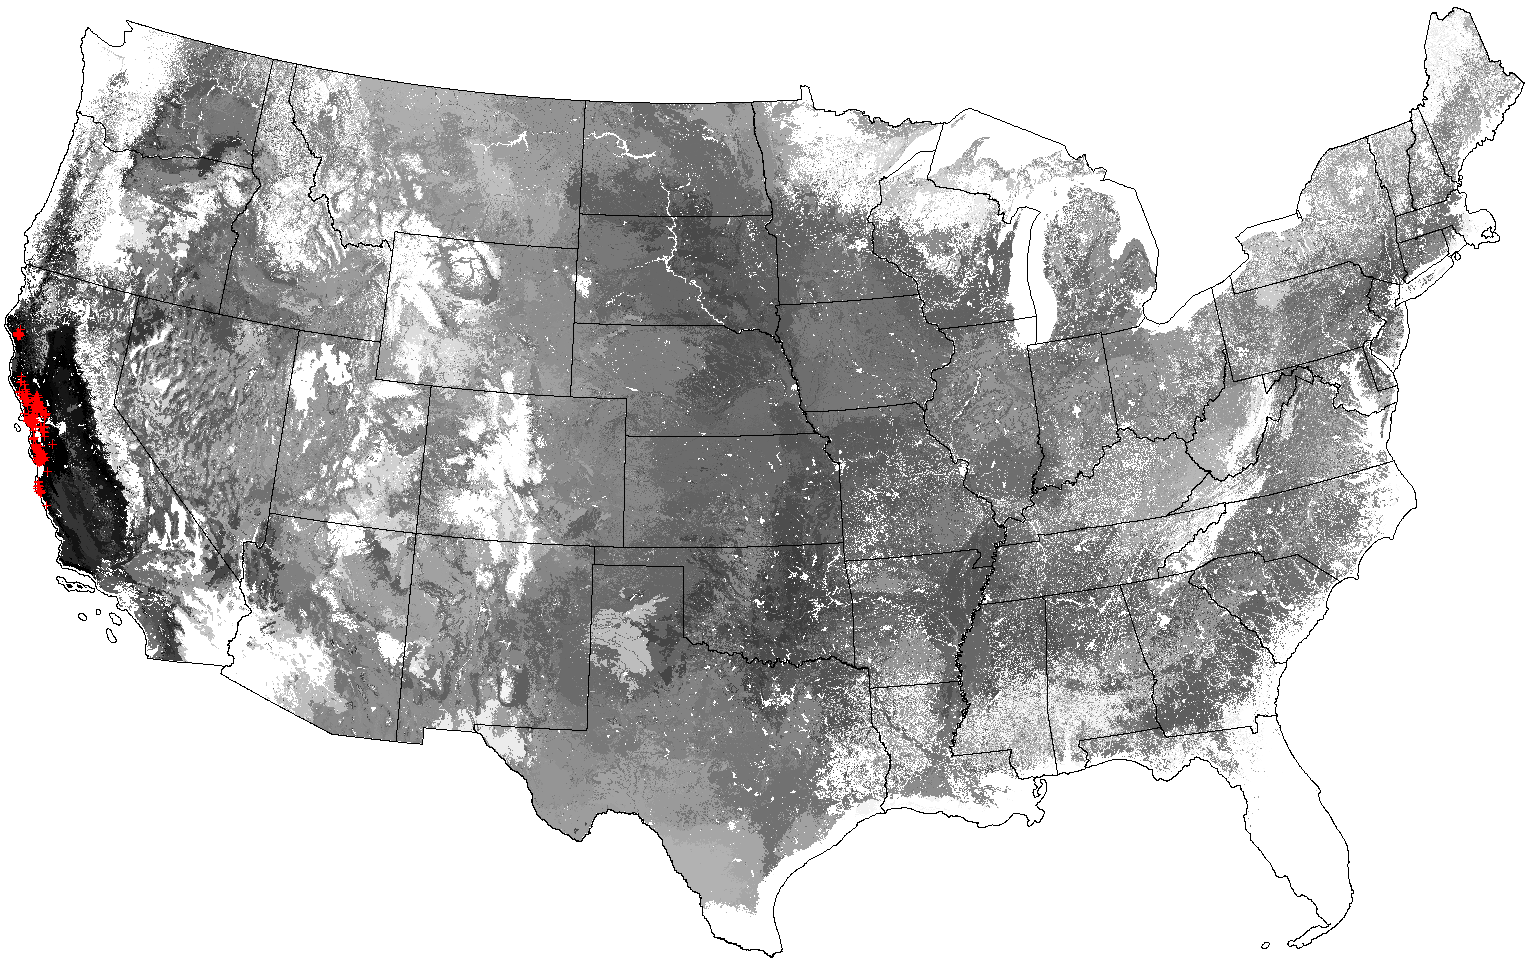
The same quantitative ecoregionalization-based process
has proven useful for mapping the risk that Sudden Oak Death (SOD), Phytophthora
ramorum, will spread to other parts of the U.S. The susceptibility of forests beyond the west coast of the United States to SOD
is unknown, but is the subject of speculation, since the spread of the SOD epidemic
could represent a serious threat to eastern forests. I
createdcustom statistical SOD-relevant ecoregions using
national maps of conditions likely to be limiting
for P. ramorum, including humidity, leaf-wetness, and cool
temperatures. My analysis of the quantitative multivariate similarity of each
of these 1500
homogeneous SOD-regions with conditions in known SOD outbreak areas produced a
continuous national estimate of risk
or susceptibility to SOD (http://www.geobabble.org/~hnw/sod/report).
(6) A Practical Map-Analysis
Tool for Corridor Detection
I led the development of a landscape map analyzer tool which will identify and map
corridors and barriers to plant and animal movement across any map. Corridors
are important, since they show the "roadways" most commonly used by plants and
animals as they move or disperse across a mapped landscape. The tool is based
on the idea of island biogeography, and considers the map as isolated patches of
high-quality habitat embedded in a matrix "sea" of all other patches of lower
quality.
Corridor connectance, whether we wish to preserve it for a threatened species or
impede it for an invasive exotic, is a critical concept in biodiversity
management. Despite this importance, the idea of corridors remains largely
conceptual. Few analytical management tools exist which can examine a
real-world map, quantify connectance, and identify potential corridors.
The tool we developed, called “Pathway Analysis Through Habitat,” or
PATH, uses simulated virtual plant and animal "walkers" which are imbued with
movement characteristics and preferences of particular animal or plant species, and
allows large numbers of these imaginary digital walkers to travel over the map.
Walkers representing individuals "try" to successfully disperse from one "island"
patch of favorable habitat to another "island" in the archipelago, and, in so doing,
define and map the best potential movement dispersal corridors. The spatial
arrangement and amount of patches of habitat, roads, urban areas and other real-world
landscape features will affect the movements and successful dispersal of walkers, and
therefore the routes of potential corridors across the map.
PATH provides realistic guidance for conservation and management
decisions. PATH patch importance values can be used to direct and
prioritize planning for conservation and remediation. A land manager can easily
see which habitat patches are the most important targets for conservation or
strenuous remediation (for a threatened species) or for elimination (in the case of
an invasive species). In the case of an invasive species, patches important as
connecting corridors, once identified, would be the first places that a manager would
want make inhospitable for the invader. Construction of unsuitable or barrier
patches, or elimination of particular favorable "bridge" patches may be suggested
which will discourage movement of invasive species along existing corridors.
For threatened species, patches with high importance should be protected strenuously
or preferentially remediated; while patches with low importance are more available
for alternative use or development.
The PATH tool was developed using funding from the Southern Appalachian
Information Node (SAIN) of the National Biological Information Infrastructure (NBII)
of the US Geological Survey, the Army Corps of Engineers ERDC-CERL, and the National
Petroleum Technology Office, DOE. The prototype was initially run on small
artificial test maps to evaluate its behavior for simple artificial landscapes designed to
produce expected intuitive results , and then simple
actual landscapes (Exhibit #2, Publication #60, with 43 citations). As a
parallel application running on a supercomputer, the PATH tool is
computationally powerful enough to analyze even extensive,
highly-fragmented real-world landscapes. A CERL Technical Report, for
example, describes how the PATH tool was used to analyze Red-cockaded
woodpecker movement across the Southeastern United States (Publication #62). A
manuscript showing potential gopher tortoise movement corridors within and around
Fort Benning, GA using the PATH tool is being prepared for publication
(http://www.geobabble.org/~hnw/walkers/gophertortoise).
Because of the level of interest shown by the US Armed Forces in analyzing
connectance within and near military bases, I worked with ERDC-CERL to translate the
PATH tool into the NetLogo language, so that PATH no longer requires
the use of a parallel supercomputer, thus making it more accessible to resource
managers (Publication #89).
(7) Forest Tree Species Range
Shifts Under Two Alternative Climate Change Forecasts (ForeCASTS)
Climate change poses a severe threat to the
viability of several forest tree species, which may be forced either to adapt to new
conditions or to shift their ranges to more favorable environments. Species
already having limited geographic ranges may be at highest risk. Along with
Kevin Potter, I used spatial models of future environmental conditions to predict the
location and quality of habitat for several hundred tree species under different
climate change models and emissions scenarios. We also are determining where
each species, within its current range, is most susceptible to local extirpation as a
result of climate change.
In our Forecasts of Climate-Associated Shifts in Tree Species (ForeCASTS)
project, range shifts for 215 tree species were predicted globally following future
climate changes forecast by the Parallel Climate Model (PCM) and the Hadley climate
model under IPCC scenarios A2FI and B2 for the years 2050 and 2100 (See Exhibit
#4). Most species' predicted suitable (or fundamental) ranges closely followed
or were slightly more extensive than actual (or realized) ranges under present
conditions (as compared to Elbert Little’s tree range maps). We have also developed a new climate change impact
analysis method, Minimum Required Movement (MRM) Distances. MRM distance
determines how far a species would have to move in order to arrive at the nearest
location with the same combination of conditions they had prior to a climatic
change. Global maps showing MRM distance to return to the closest
geographic locations offering suitable conditions in the future directly show the
likelihood of local extirpation following climate change. Locations that are
the nearest "lifeboats" for large surrounding areas may represent management and
conservation targets.
Resource managers, land-use planners and conservation organizations can view
ForeCASTS future host range maps for any species at http://www.geobabble.org/~hnw/global/treeranges3/climate_change/atlas.html.
Unlike existing tree range shift prediction atlases, which are limited to the eastern
or western United States, ForeCASTS maps are global in extent. With maps
for 215 tree species, ForeCASTS already covers many more tree types than
earlier tree-shift climate change efforts. Although the Version 3 future range
maps in the atlas are still considered provisional, results for several tree species
have already been used in planning for several NFs (Francis Marion and Sumter NFs)
and several states (NC, Linda Pearsall, NCDENR, and WA and OR, Carol Aubry, USDA FS,
Olympic NF). ForeCASTS species range shift results are also being cited
in the National Climate Assessment (NCA) Forestry Technical Report that is being
currently prepared for Congress.
The ForeCASTS project is still underway, and our poster showing preliminary
results received the “Most Exciting
Science” Award at the Annual Forest Service Forest Health Monitoring (FHM) Work
Group meeting held in Albuquerque, New Mexico in April 2010. We
anticipate that Version 4 of the ForeCASTS species atlas will contain
predicted future host range maps for more than 325 tree species, covering essentially
every woody species whose home range extends into the conterminous United
States. Version 4 is
expected to be completed and available to managers by the end of FY2012. This
is a Knowledge Discovery and Knowledge Synthesis and Assessment Accomplishment.
(8) Forest Service “Eye
in the Sky” Early Warning System Monitors Forest Disturbances Nationally
Along with our
cooperators/collaborators, I conceived and established the ForWarn
National Early Warning System (see Exhibit #5, Publication #53, describing the
prototype), which produces maps showing potential forest disturbance across the
conterminous United States at 231m resolution every 8 days, based on images obtained
over the preceding 24-day analysis window (view
introductory video [large download!]). The
EFETAC/WWETAC ForWarn system provides a strategic national overview of
potential forest disturbances, identifying and directing attention and resources to
locations whose forest behavior seems unusual or abnormal. The purpose of
ForWarn is to alert, focus and direct ground and aircraft observation
efforts, resulting in maximum utility and effectiveness. ForWarn
has been operating since January 2010, and generates national disturbance maps
covering the entire lower 48 United States every 8 days, even throughout the winter
(to permit, for example, tracking ice storm damage, and the accumulation and melting
of snowpack). ForWarn detects most types of forest disturbances,
including insects, disease, wildfires, frost and ice damage, tornadoes, hurricanes,
blowdowns, harvest, urbanization, and landslides. It also detects drought,
flood, and temperature effects, and shows early and delayed seasonal vegetation
development. Cells in the map are about 5 ha, or 13 acres, or 9 football fields
each. No such national-scale system based on remote sensing has been developed
specifically for forest disturbances before. ForWarn is the
result of an ongoing, substantive cooperation among four different government
agencies: USDA, NASA, USGS, and DOE.
ForWarn works by comparing current greenness with the
“normal” greenness that would be expected for healthy, undisturbed
vegetation growing at this location during this time. Locations that are
currently less green than expected are marked as potentially disturbed.
A set of three disturbance products use
differing lengths of historical baseline periods to calculate the expected normal
greenness, highlighting how recent the potential forest disturbance may be. The
long-term baseline products show all disturbances since 2003, while the intermediate
baseline products show disturbances occurring within the prior three years, and the
short-term baseline products show only forest disturbances that occurred within the
last year. Disturbance maps are available to anyone via a
web site, the Forest Change Assessment Viewer (see Section 4D4), which showcases recent and historical
ForWarn national disturbance maps in context at http://forwarn.forestthreats.org/fcav
Using this Assessment Viewer, resource managers can see the newest national
ForWarn disturbance maps at the same time the Threat Centers do.
ForWarn proved especially useful for mapping
disturbances during the 2011 growing season, including tornadoes, wildfires,
extreme drought, and insect defoliations (see Exhibit #6, also the article in
Space News,
April 2012, and the Capital Ideas
- Live! interview). The number of ForWarn-based alerts we
issue varies widely, but we average about 2-3 alerts from every new 8-day
product. Regional FHM Coordinators are always copied on alerts for potential
disturbances within their region. ForWarn was used to map tornado
scars from the historic April 27, 2011 tornado outbreak, and detected and mapped
timber damage within more than a dozen tornado tracks across northern Mississippi,
Alabama and Georgia.
In at least three cases so far (Atchafalaya,
LA in 2010 and
2012, forest tent caterpillars and bald-cypress leafrollers, and
Allegheny NF, PA in 2011, fall webworms), ForWarn has alerted local
resource managers to otherwise unknown insect defoliation activity. In the
Atchafalaya 2010 and 2012 cases, an extra, unplanned ADM flight was made which
verified the defoliation. In the Allegheny NF case, defoliation was verified by
ground observations.
ForWarn tracks disturbance in all vegetation, not just forests,
and includes potential disturbances in rangeland vegetation and agricultural
crops. This all-vegetation feature of ForWarn is expected
ultimately to widen the potential user audience to include farmers and range
livestock managers as well as forest owners and managers. We also plan to
inform USDA National Agricultural Statistics Service (NASS) and USDA Risk Management
Agency (RMA) to see if ForWarn results can be leveraged elsewhere
within our own agency.