|
William W. Hargrove and Forrest M. Hoffman
A combination of multivariate analysis and ecological expertise was used to create 20 national National Ecological Observatory Network (NEON) Domains. In a subsequent step, groups of researchers within each Domain will prepare Prospecti in which they will advocate particular geographic configurations of sub-node components within their domain. While it is not necessary for a node to represent all of the conditions found within a Domain, configurations which maximize Domain representation will be favored in the selection process.
The same multivariate tools that were used to help create the 20 NEON Domains can also be used to guide the deployment of sub-node components efficiently within each existing NEON Domain in the continental United States. The initial basis for NEON Domain development was a map produced by a multivariate clustering process using nine climatic variables as inputs. Each climatic variable is itself a map at 1 km2 resolution over the conterminous United States, consisting of nearly 8 million cells.
In Multivariate Geographic Clustering (MGC), normalized variable values from each map for each raster cell are used as coordinates to plot each map cell in an environmental space with as many axes as there are multivariate environmental dimensions. Because the plotted location of map cells in data space employs the combination of environmental variables within that map cell, two map cells that are plotted close to one another in data space will have similar mixtures of environmental conditions, and are likely to be classified into the same region cluster. Thus, similarity is coded as separation distance in this data space.
The algorithm begins with a user-specified number of region clusters, k, into which the map cells are to be grouped. In a single iteration, each map cell is assigned to the closest (i.e., environmentally most similar) existing cluster average, or centroid. At the end of the iteration, the coordinates of all map cells within each group are averaged to produce an adjusted centroid for each cluster, and another iteration of assigning map cells to these new centroids begins. After the grouping process has converged, the k regions have been statistically defined. The process is similar to unsupervised classification for remotely sensed imagery, but ecologically relevant conditions are used rather than spectral reflectances.
The k-means algorithm tends to fit globular clusters of equal size in data space. This control of within-group variance tends to produce regions with uniform heterogeneity, and prevents the creation of regions that have vastly different within-region variance. Regions produced can be spatially disjoint, but tend to be geographically cohesive due to the spatial autocorrelation which is usually present in the environmental input data.
NEON Domains were not exclusively formed by the quantitative multivariate clustering procedure. Starting with a 25-cluster map based on nine climatic factors, subregions were identified and combined with their parent region complexes. Domain borders were generalized by coarsening resolution, running a de-speckling filter, and vectorizing. Islands and spatially disjoint regions were dropped, and borders were added to incorporate dynamic frontal patterns, to accommodate soil differences, or to split very large regions into layers used into practicable size. This sequence of maps shows the stepwise development of the NEON Domains.
Although each map cell is unequivocally classified as a member of only one region, the degree of "belongingness" of each map cell to its final group can be quantified. Hargrove and Hoffman (1999) used the Euclidean distance between each map cell and the centroid of the cluster to which it was assigned in the multidimensional data space as an index of each cell's within-group (or within-region) representativeness. Map cells that lie close to the Domain centroid in data space are good representatives of the average or nominative conditions for that Domain. However, map cells that lie far from the Domain centroid are located on the outer periphery of that data cluster, and more poorly represent conditions typical for that Domain. Such peripheral map cells might have changed cluster assignment in subsequent iterations of the classification algorithm. Displayed as an elevation surface draped with the quantitative region assignments, Hargrove and Hoffman (1999) created maps showing whether the borders between adjacent quantitative regions were sharp and distinct, or gradual, or changed character along their length.
A similar method for quantifying within-Domain representativeness was used here, except that the centroids of the final adjusted NEON Domains were empirically calculated, and the representativeness results were depicted as mapped gray levels rather than pseudo-elevations. The final NEON Domains were used to segregate the nine data layers used in the original cluster analysis for NEON Domains. A centroid was calculated for every map cell that is a member of that NEON Domain. This Domain centroid represents the mean combination of conditions for that NEON Domain. This synoptic or nominative Domain combination may not actually be represented by any map cell within that Domain.
We calculated the Euclidean distance from each map cell to the empirical centroid of the NEON Domain to which it was assigned. Distances were calculated within an orthogonal, nine-dimensional PCA space. We mapped these distances as log-transformed gray levels. The resulting map shows areas which are highly representative of climatic conditions within their Domains as dark gray, while areas which are poorly representative are lighter gray.
Blacker areas, as locations typifying Domain-wide conditions, would be good candidate locations for sub-node components (assuming that the urban-to-wild and aquatic transitions existed within them, and that separation distance and other NEON criteria were met). Alternatively, an argument could be made that particular lighter gray areas, as important Domain "outliers," need to be sampled as well.
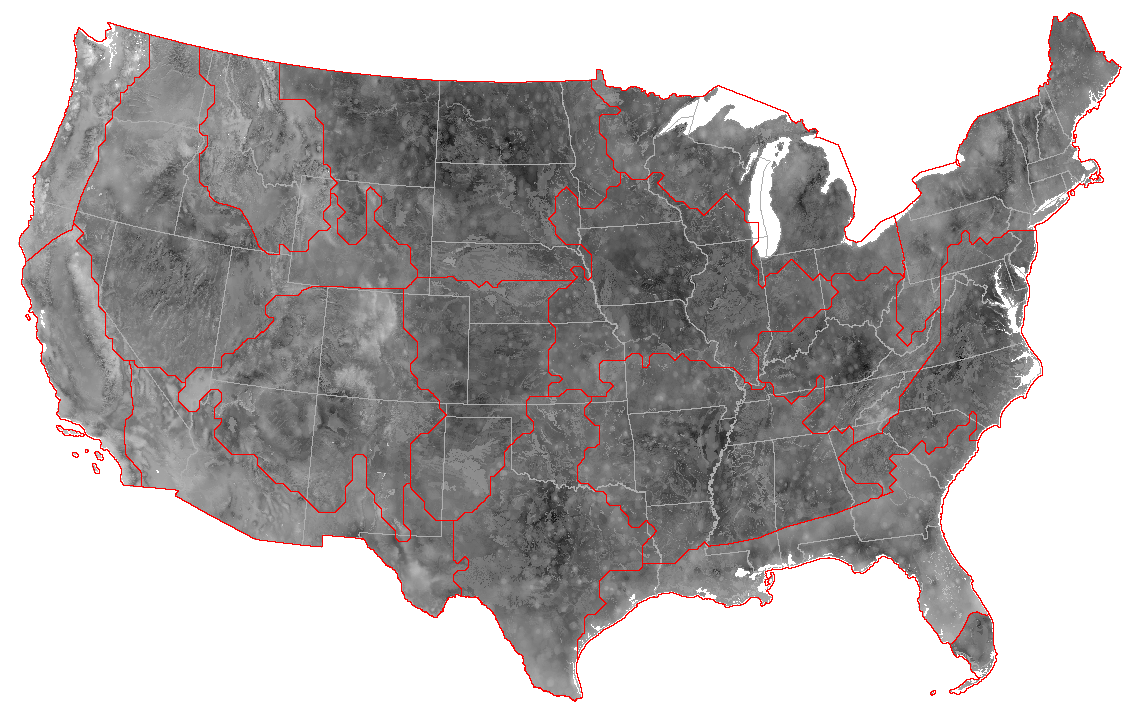
NEON Within-Domain Representativeness Small Map Medium Map Large Map Huge Map |
Darker "core" areas in the map tend to be located in central locations within NEON Domains, except when overridden by local conditions. The Northeast Domain has a central "spine" of darker areas, as does the Michigan peninsula. Areas typically thought of as more homogeneous, like the Northern and Southern Plains Domains, the agricultural areas of the Prairie Peninsula Domain, and the Ozarks Complex have distinctly darker central "core" regions, and are among the darkest Domains in the map. The log-transformed distance values, shown as they are colored in the map, are near-normally distributed continentally.
Mountains, as unusual topographic features, are generally less representative of Domain-wide climatic conditions. The Appalachian Mountains within the Appalachian/Cumberland Domain, the Sierras in the Pacific Southwest Domain, and the Rocky Mountains within the Northern and Southern Rocky Mountain Domains are lighter shades of gray. As nominative and distinguishing features of these Domains, however, these locations may still represent good candidates for locations of sub-node components.
Western Domains tend to be lighter gray than central and eastern Domains. This result echoes the general perception that elevation and climatic factors are more heterogeneous in western locations. Domains located within the central continent tend to be darker than Domains on the continental periphery, reflecting more homogeneous continental versus maritime climates.
Examination of within-Domain representation with respect to lines added after the MGC analysis shows no clear influence on within-domain representativeness. Domains with added borders still generally show darker "core" areas which are central, with no obvious effect on degree of overall Domain representation. The Atlantic Neotropical Domain, created by the addition of the Domain border in southern Florida, is fairly dark, but the addition of this Domain causes a gradual fading of representation in the Southeastern Domain as one proceeds down the Florida peninsula toward this added border. The white circles that can seen at the highest resolutions, particularly in areas with little topographic relief, are probably meteorological stations having local orographic conditions that produce a systematic offset from the surrounding area.
Within-Domain representativeness is calculated with respect to the combination of multivariate characteristics that are selected, and will vary depending on the input layers that are included. The analysis could be repeated with different layers, either by adding additional map layers to the ones used originally to help define NEON Domains, or by using an entirely different set. Adding information about soils and geology, hydrology, and human population in a similar analysis would likely produce results that were both interesting and useful for the design of NEON nodes.
This type of analysis can also be used to find "core" areas of good representativeness for any existing set of regions or polygons. For example, "core" areas could be found for each of the Omernik or Bailey ecoregions, for a particular vegetation cover or land-use type, for a particular soil type, or even for a particular state or county, based on any desired set of environmental descriptors.
Hargrove, W.W., and F.M. Hoffman. 1999. Using multivariate clustering to characterize ecoregion borders. Computers in Science and Engineering 1(4):18-25. Invited. Special Issue on Scientific Visualization of Massive Data Sets. Also available with additional figures at http://research.esd.ornl.gov/~hnw/borders
Hargrove, W.W., and F.M. Hoffman. 2004. The potential of multivariate quantitative methods for delineation and visualization of ecoregions. Environmental Management 34(5):S39-S60.