William W. Hargrove, Forrest M. Hoffman, Paul F. Hessburg, and Brion Salter
|
under development
List of WX-BGC Model Output Types Selected for Potential Use
The list of 24 variables shown above was selected from the saved WX-BGC model outputs after having run the model in every square kilometer of the conterminous United States for each of four vegetation types: C3 grasses, C4 grasses, Evergreen Needleleaf Forests, and Deciduous Broadleaf Forests. Although we were only contracted to run Evergreen Needleleaf Forest and C3 Grasses, we performed the simulations for all four possible vegetation types within WX-BGC. Simulations were spun up within each cell for each vegetation type until equilibrium was reached, and then ran daily for 18 historical calendar years of climatic driver data from the DAYMET database. Each of these stored outputs represents a map with more than 7.8M cells.
Many of the driver data were identical across the four vegetation types. In initial pairwise correlation tests, many of the variables were found to be highly correlated, both within and across vegetation types. The link below explains how we objectively dropped variables that were cross-correlated to reach a more parsimonious subset of layers that still contained the same information.
Method Used to Drop Multi-Collinear Model Output Variables
Our objective was not to reach a minimum parsimonious set. Even if only 10% of the information added by a potentially included variable is unique, relative to that already contributed by other existing variables, it could still be that that new information discriminates map cells into two distinct biophysical regions under certain circumstances. Therefore, our goal was to be inclusive rather than minimalist, without carrying large numbers of highly redundant variables through the analysis.
The list below shows the 96 variables included in the analysis. The middle part of the map name defines the vegetation type; all indicates a driver variable that is identical for all four vegetation types, while grasses indicates a variable that is identical for both C3 and C4 grasses. The remaining variables are labeled with one of the four vegetation types.
List of WX-BGC Model Output Layers Used
 |
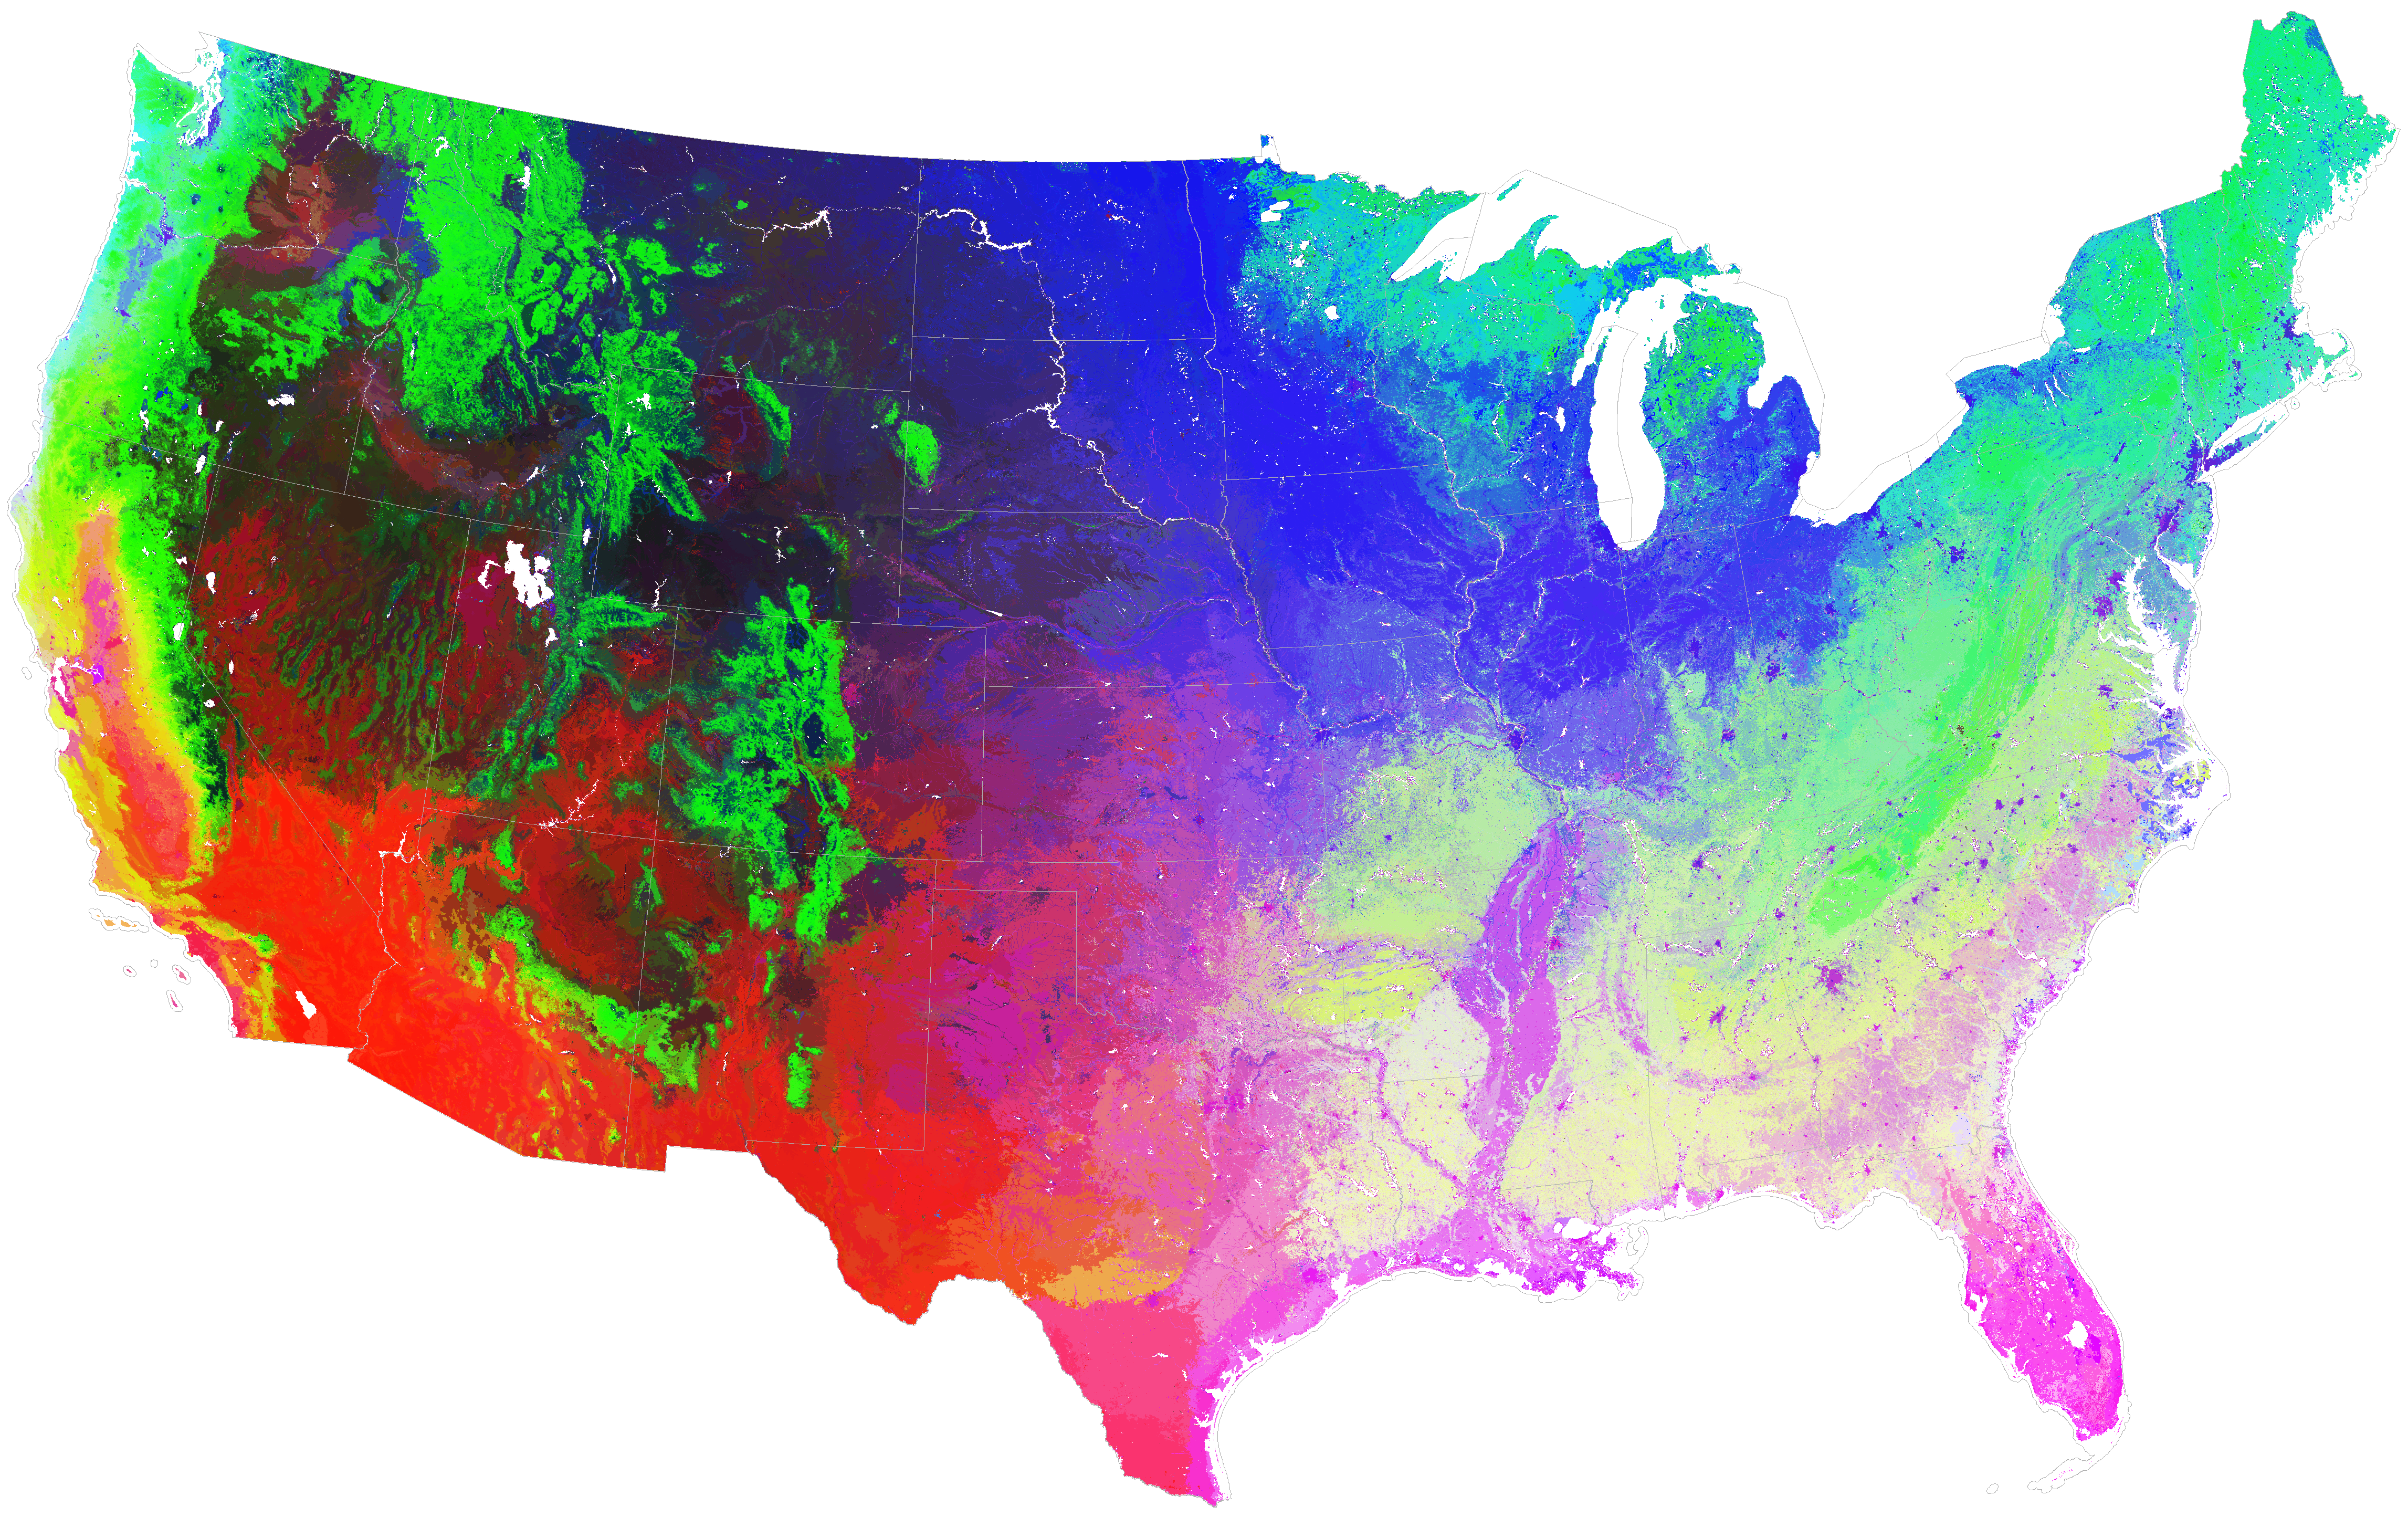
The WX-BGC-derived wildfire biophysical map is shown below in Similarity Colors. Factor 1 is wetness and tree productivity, shown in green. Factor 2 is grass productivity, shown in blue. Factor 3 is warmth, shown in red. Lighter colored areas have large values of all Factors, while darker areas have small values of all Factors.
 |
3000 final Biophysical Region centroids, in terms of PCA space, for the WX-BGC Version
3000 final Biophysical Region centroids, in terms of original units, for the WX-BGC Version
List of Remote Sensing Layers Used
The 36 variables for the remote sensing based version of biophysical layers were selected to provide information on wildfire fuels, burning conditions, growing conditions, physiographic position, ignition likelihood, and combinations of these. For example, maps of warm-weather precipitation sum and days with precipitation events provide information about growing conditions for fuels, while maps of counts of warm-weather days without precipitation and consecutive days without precipitation provide information about ignition likelihood.
The first 9 of these variables were generated using the DAYMET 18 year historical data set at 1 km2 resolution across the lower 48 United States to calculate locations that met a range of criteria for temperature, precipitation, wetness and dryness conditions. Because we believe that wildfire occurrence and spread is controlled by extreme events, we generated maximum values per year over the 18 DAYMET years, rather than mean values. To prevent unusual values from having undue influence, we used the penultimate rather than the ultimate maximum values over the 18 year meteorological sequence. A national map was produced for each criterion that we developed and applied to the DAYMET data.
Vapor Pressure Deficit (VPD) measures condensation potential, and is corrected for temperature and relative humidity effects. Lower VPD represents wetter conditions, and when VPD reaches zero, condensation has occured somewhere in the system. We included two VPD-based dryness measures (mean days and consecutive days < 750 Pa) as information about fire behavior, as well as one VPD-based measure of wetness (warm-weather VPD < 1000 Pa) for both fire dynamics and conditions of vegetation growth.
 |
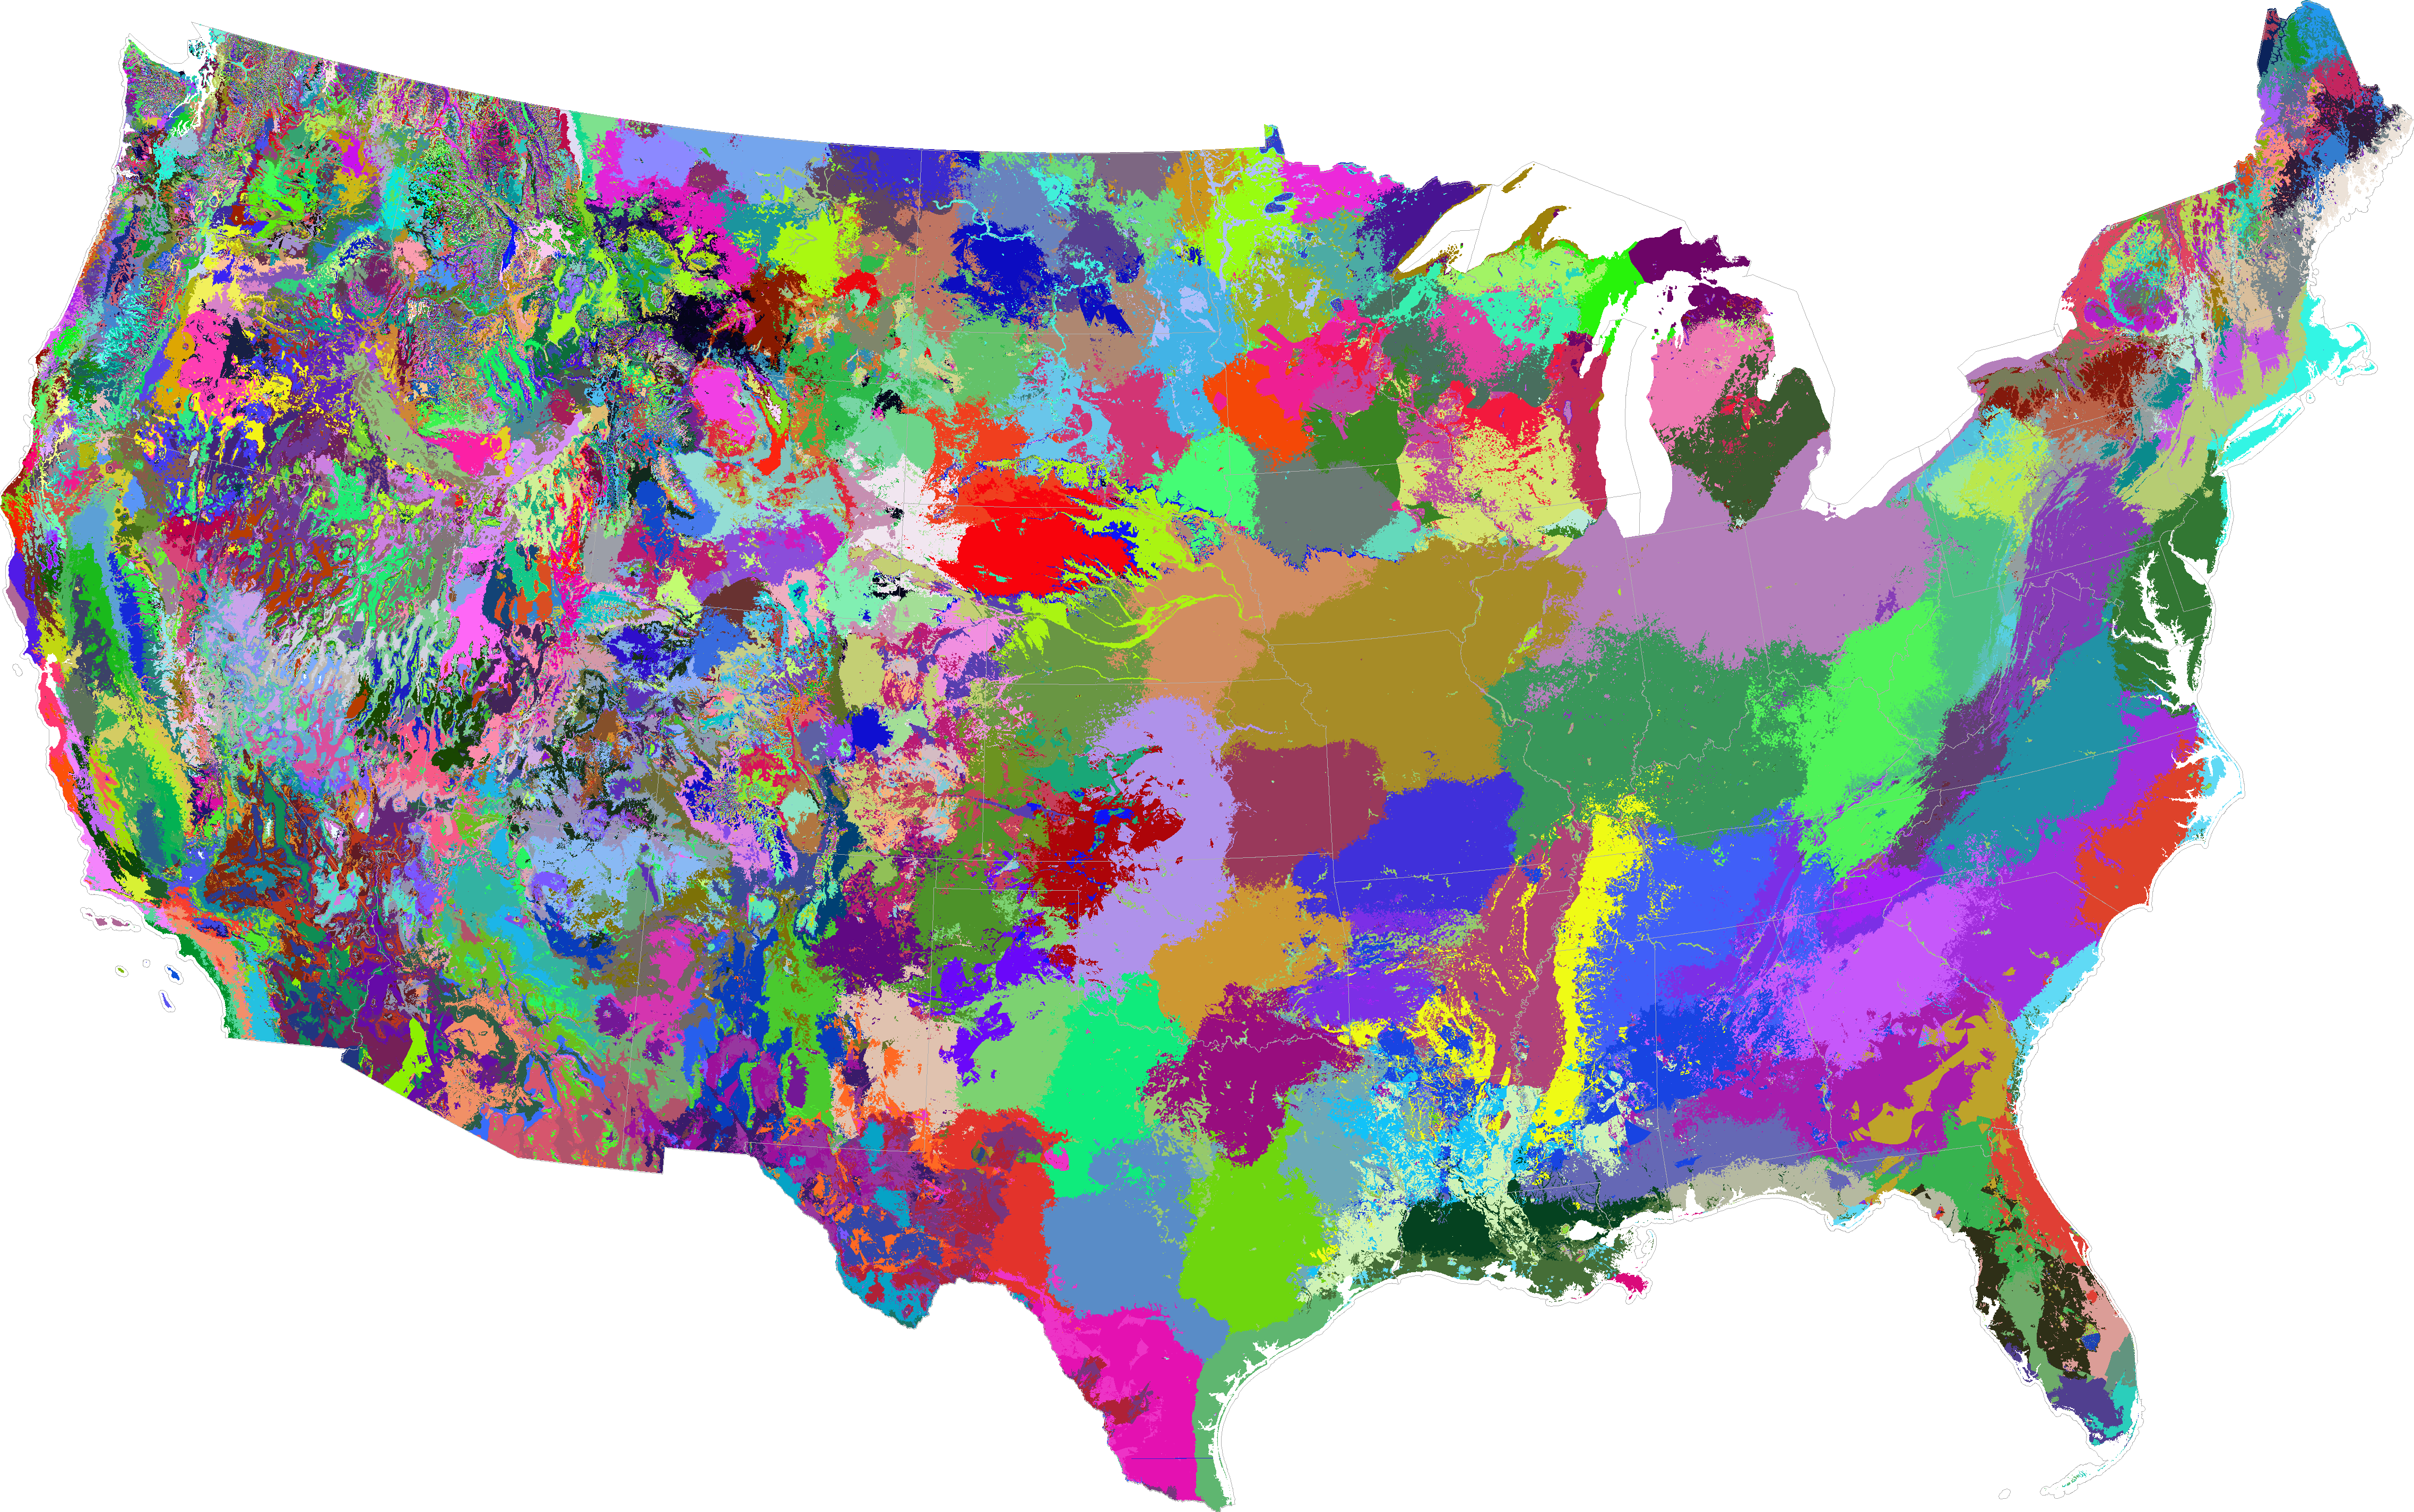
The remote sensing based wildfire biophysical regions are shown in Similarity Colors below. PC 1 is heat and dryness, shown in red. PC 2 is productivity, especially in the non-growing season, shown in green. PC 3 is precipitation, shown in blue. Lighter colored areas have large values of all Factors, while darker areas have small values of all Factors.
|
3000 final Biophysical Region centroids, in terms of PCA space, for the Remote Sensing Version
3000 final Biophysical Region centroids, in terms of original units, for the Remote Sensing Version
The biophysical regions produced from the WX-BGC output variables are larger, more homogeneous, smoother and more generalized in appearance than the biophysical regions generated from remote sensing data. In each case, biophysical regions in the eastern US are larger than in the west. Western fuelscapes have more topography, and steeper environmental gradients of precipitation and temperature, resulting in smaller homogeneous biophysical regions than in the east.
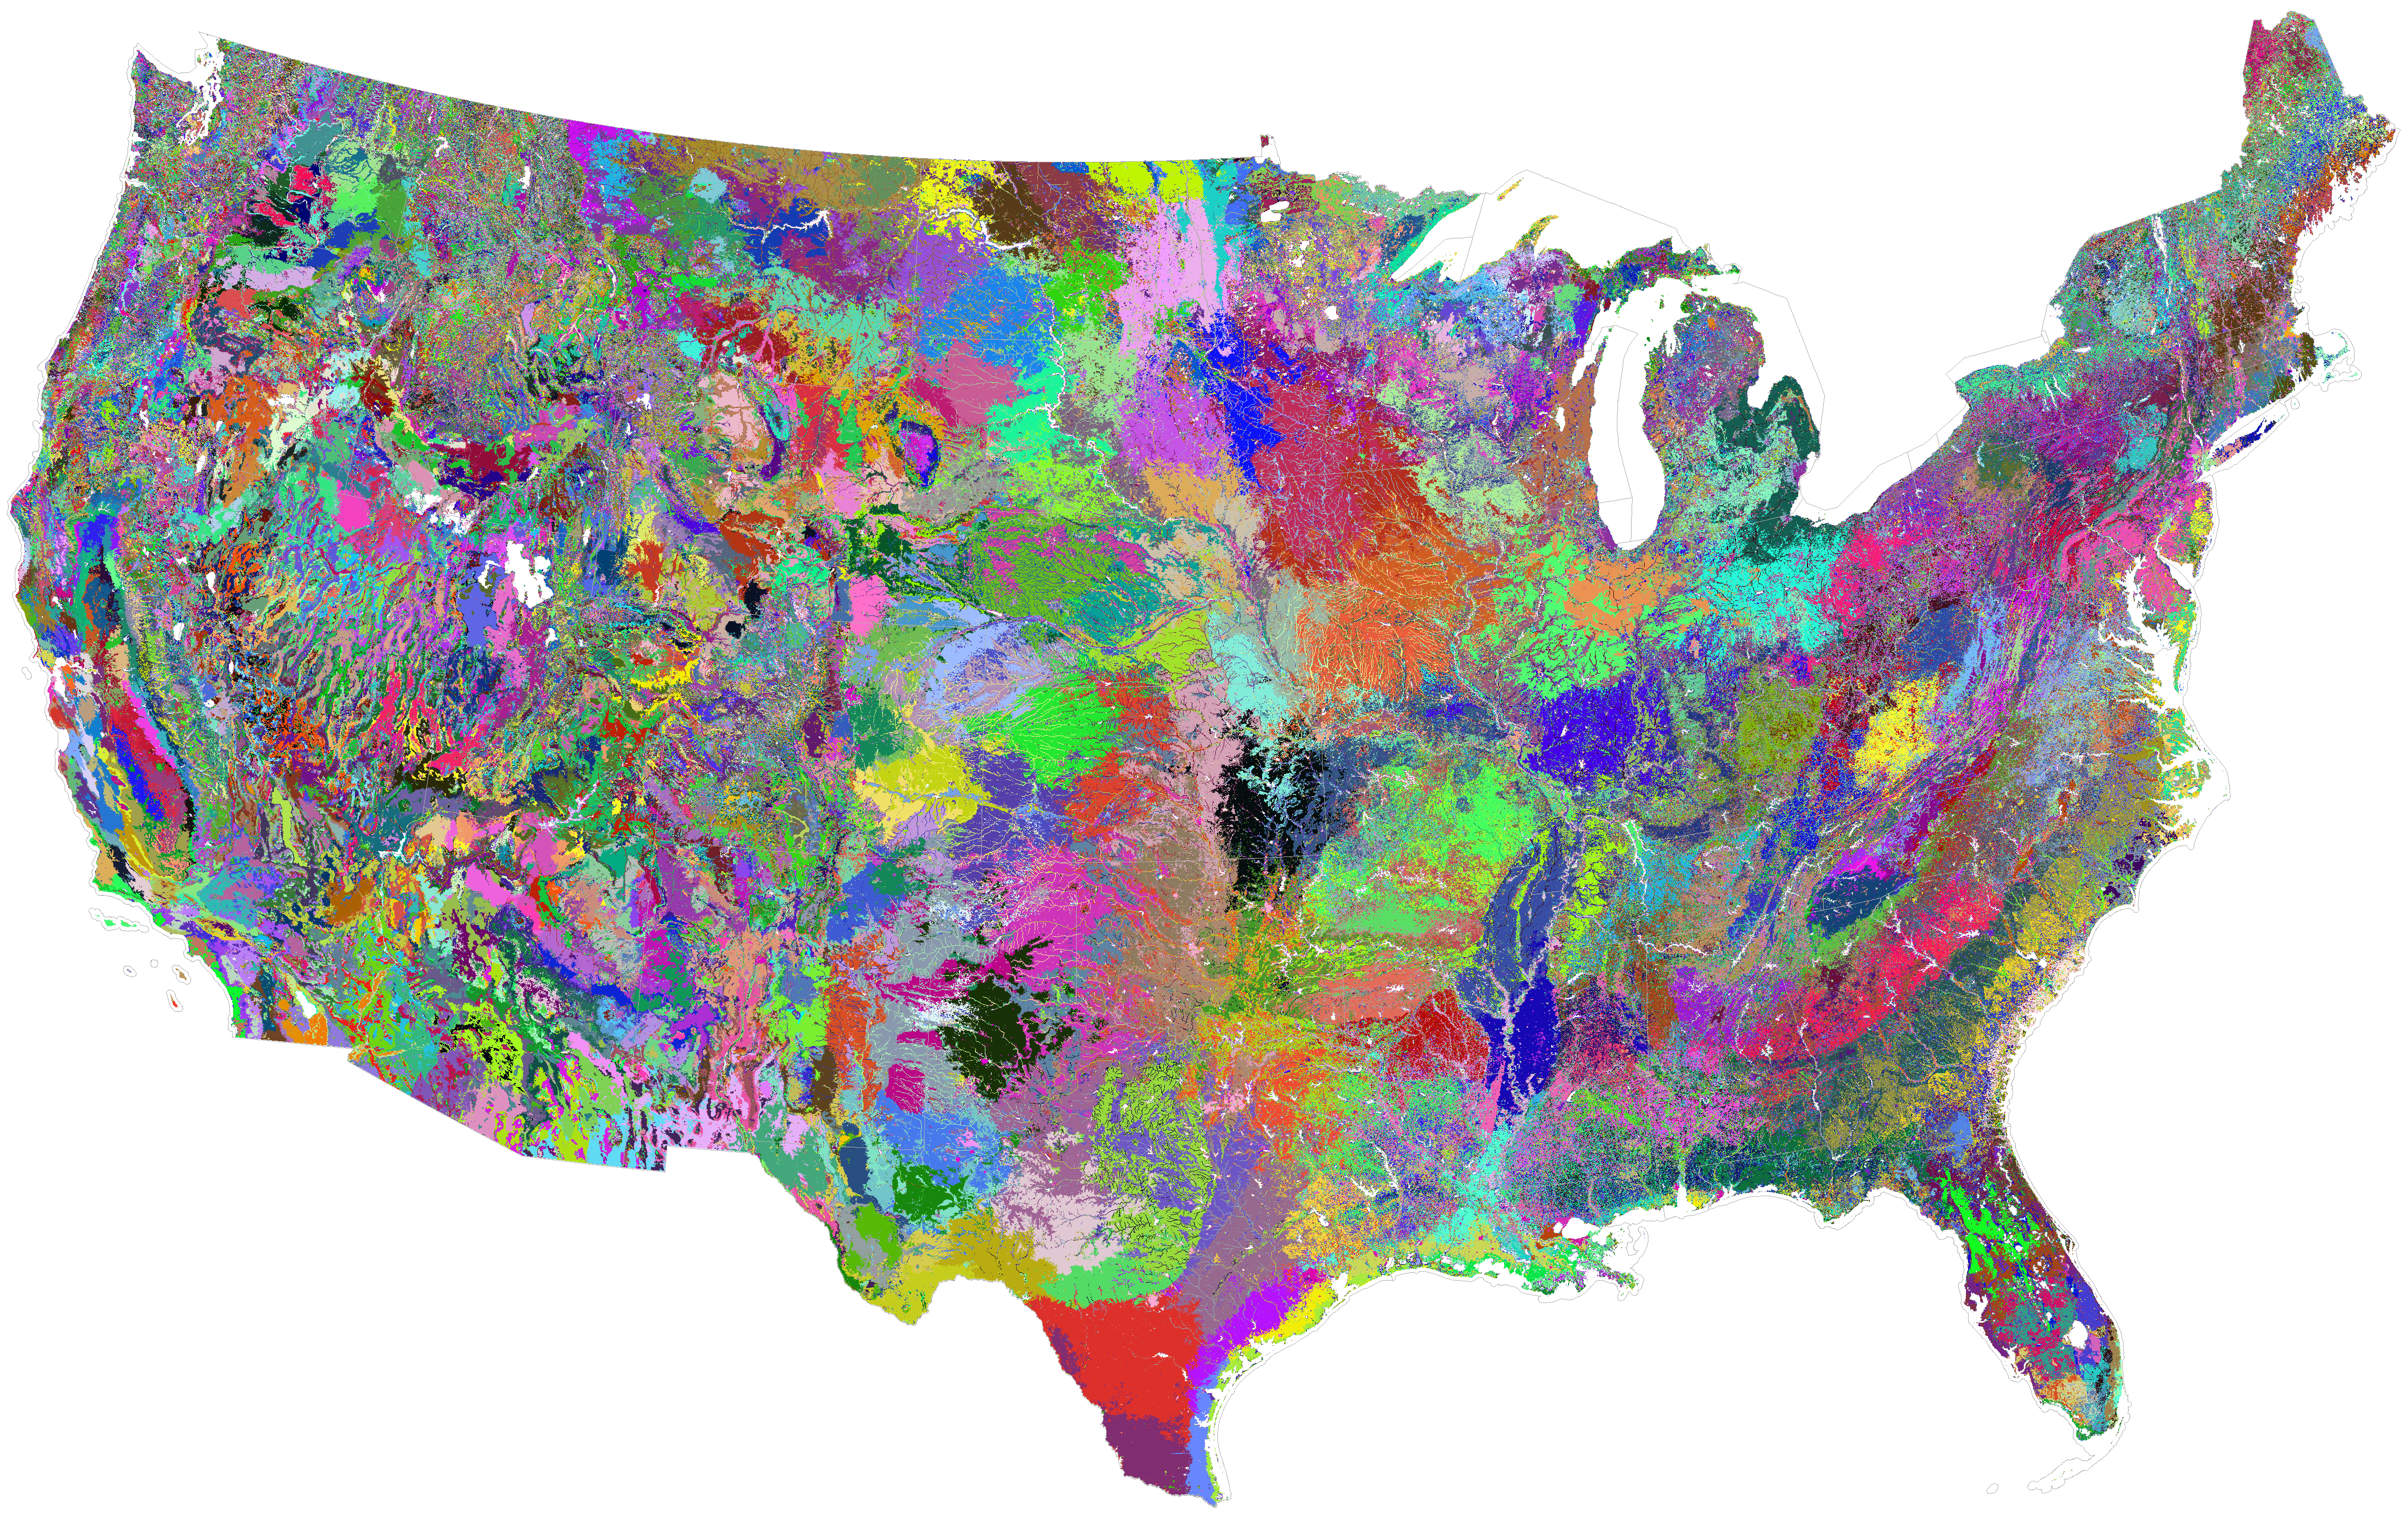
One reason for the smoother regions in the map from modeled output is that those layers do not contain topographic information, i.e., slope and aspect. The remotely sensed biophysical region map contains Compound Topographic Index, and also total solar insolation, including topographic effects. For this reason, river channels, mountaintops, and other topographic and slope position differences can clearly be seen in the remote sensing version.
The main factor likely to be responsible for the homogeneity in the biophysical regions from WX-BGC outputs is that the model is aware only of primary drivers forcing vegetation growth. As such, it produces potential vegetation. The remote sensing layers, on the other hand, include information about existing vegetation, and thus include disturbance that may have altered the expected potential vegetation present at a particular location. Both natural and anthropogenic disturbances are included in the remote sensing version. Thus, agriculture and urbanization are visible in the second map, but not in the first. These disturbance effects serve to make the biophysical regions heterogeneous in the second map.Using the enlargement produced by clicking on the second map shows that, at smaller scales, particular areas are dominated by a single biophysical region. But it also shows many heterogeneous sub-regions, like river networks, that are due to topography, land use, and disturbance history. From far fewer input variables, a greater richness is available.
Understanding that the WX-BGC-derived map describes potential vegetation while the remote sensing map describes actual vegetation, one might expect differences due to natural and anthropogenic disturbance to cause differences between the maps.
under development
Cluster-the-3000-clusters dataset for Twinspan pseudo-hierarchical run from the WX-BGC Outputs Map
Cluster-the-3000-clusters dataset for Twinspan pseudo-hierarchical run from the Remote Sensing Map
For additional information contact: